Saturation vapor curve
Appearance
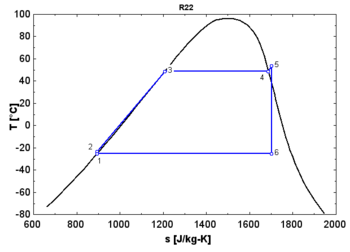
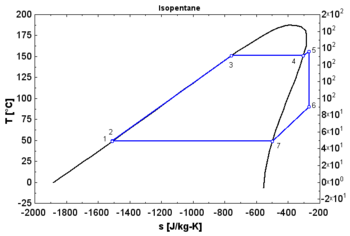
The saturation vapor curve is the curve separating the two-phase state and the superheated vapor state in the T-s diagram. The saturated liquid curve is the curve separating the subcooled liquid state and the two-phase state in the T-s diagram.[1]
When used in a power cycle, the fluid expansion depends strongly on the nature of this saturation curve:
- A "wet" fluid shows a negative saturation vapor curve. If overheating before the expansion is limited, a two-phase state is obtained at the end of the expansion.
- An "isentropic" fluid shows a vertical saturation vapor curve. It remains very close to the saturated vapor state after an hypothetical isentropic expansion.
- A "dry" fluid shows a positive saturation vapor curve. It is in dry vapor state at the end of the expansion, and strongly overheated.
See also
References


