Stroud District Council elections
Appearance
One third of Stroud District Council in Gloucestershire, England is elected each year, followed by one year without election.
Political control
Since the foundation of the council in 1973 political control of the council has been held by the following parties:[1][2]
| Party in control | Years |
|---|---|
| No overall control | 1973 - 1976 |
| Conservative | 1976 - 1984 |
| No overall control | 1984 - 1996 |
| Labour | 1996–1998 |
| No overall control | 1998 - 2002 |
| Conservative | 2002 - 2011 |
| No overall control | 2011 - |
Council elections
- Stroud District Council election, 1973
- Stroud District Council election, 1976
- Stroud District Council election, 1979
- Stroud District Council election, 1983 (New ward boundaries)[3]
- Stroud District Council election, 1984
- Stroud District Council election, 1986
- Stroud District Council election, 1987
- Stroud District Council election, 1988
- Stroud District Council election, 1990
- Stroud District Council election, 1991 (New ward boundaries & district boundary changes also took place)[4][5][6][7]
- Stroud District Council election, 1992
- Stroud District Council election, 1994
- Stroud District Council election, 1995
- Stroud District Council election, 1996
- Stroud District Council election, 1998
- Stroud District Council election, 1999
- Stroud District Council election, 2000
- Stroud District Council election, 2002 (New ward boundaries reduced the number of seats by 4)[8][9][10]
- Stroud District Council election, 2003
- Stroud District Council election, 2004
- Stroud District Council election, 2006
- Stroud District Council election, 2007
- Stroud District Council election, 2008 (Some new ward boundaries)[11]
- Stroud District Council election, 2010
- Stroud District Council election, 2011
- Stroud District Council election, 2012
- Stroud District Council election, 2014
- Stroud District Council election, 2015
- Stroud District Council election, 2016 (New ward boundaries)[12]
District result maps
-
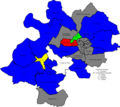
2006 results map
-
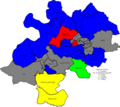
2007 results map
-
2008 results map
-
2010 results map
By-election results
1993-1997
| Party | Candidate | Votes | % | ±% | |
|---|---|---|---|---|---|
| Labour | 308 | 55.2 | |||
| Liberal Democrats | 250 | 44.8 | |||
| Majority | 58 | 10.4 | |||
| Turnout | 558 | ||||
| Labour gain from Liberal Democrats | Swing | ||||
| Party | Candidate | Votes | % | ±% | |
|---|---|---|---|---|---|
| Labour | 857 | 55.8 | |||
| Liberal Democrats | 272 | 17.7 | |||
| Conservative | 240 | 15.6 | |||
| Green | 167 | 10.8 | |||
| Majority | 585 | 381 | |||
| Turnout | 1,536 | ||||
| Labour hold | Swing | ||||
1997-2001
| Party | Candidate | Votes | % | ±% | |
|---|---|---|---|---|---|
| Conservative | 275 | 60.3 | +35.5 | ||
| Liberal Democrats | 159 | 34.9 | −19.7 | ||
| Labour | 22 | 4.8 | −15.8 | ||
| Majority | 116 | 25.4 | |||
| Turnout | 456 | 46.0 | |||
| Conservative gain from Liberal Democrats | Swing | ||||
2001-2005
| Party | Candidate | Votes | % | ±% | |
|---|---|---|---|---|---|
| Liberal Democrats | 1,319 | 35.4 | +9.5 | ||
| Conservative | 1,308 | 35.1 | +4.0 | ||
| Labour | 1,163 | 29.6 | +5.6 | ||
| Majority | 11 | 0.3 | |||
| Turnout | 3,790 | 67.8 | |||
| Liberal Democrats hold | Swing | ||||
| Party | Candidate | Votes | % | ±% | |
|---|---|---|---|---|---|
| Conservative | Tim Frankau | 652 | 39.7 | +3.2 | |
| Liberal Democrats | Brian Marsh | 609 | 37.1 | +8.1 | |
| Labour | Paul Denney | 382 | 23.2 | −11.3 | |
| Majority | 43 | 2.6 | |||
| Turnout | 1,643 | 35.8 | |||
| Conservative hold | Swing | ||||
2005-2009
| Party | Candidate | Votes | % | ±% | |
|---|---|---|---|---|---|
| Labour | Andrew Treacher | 652 | 43.4 | +4.7 | |
| Conservative | Linda Jeffreys | 425 | 28.3 | +0.0 | |
| Liberal Democrats | John Bowen | 257 | 17.1 | −4.1 | |
| Green | Helen Royall | 169 | 11.2 | −0.6 | |
| Majority | 227 | 15.1 | |||
| Turnout | 1,503 | 28.9 | |||
| Labour hold | Swing | ||||
| Party | Candidate | Votes | % | ±% | |
|---|---|---|---|---|---|
| Labour | Thomas Williams | 489 | 43.1 | +6.9 | |
| Conservative | Linda Jeffreys | 407 | 35.9 | +3.1 | |
| Liberal Democrats | Darren Jones | 238 | 21.0 | +8.5 | |
| Majority | 82 | 7.2 | |||
| Turnout | 1,134 | 22.1 | |||
| Labour hold | Swing | ||||
| Party | Candidate | Votes | % | ±% | |
|---|---|---|---|---|---|
| Conservative | Rowland Blackwell | 857 | 44.5 | +6.1 | |
| Green | Chris Harmer | 810 | 42.0 | +4.1 | |
| Labour | Jo Smith | 261 | 13.5 | +0.2 | |
| Majority | 47 | 2.5 | |||
| Turnout | 1,928 | 38.0 | |||
| Conservative hold | Swing | ||||
2009-2013
| Party | Candidate | Votes | % | ±% | |
|---|---|---|---|---|---|
| Conservative | Margaret Wigzell | 366 | 54.9 | +0.5 | |
| Labour | Audrey Smith | 177 | 26.5 | +10.8 | |
| Liberal Democrats | Adrian Walker-Smith | 124 | 18.6 | +6.8 | |
| Majority | 189 | 28.3 | |||
| Turnout | 667 | 38.8 | |||
| Conservative hold | Swing | ||||
References
- ^ "Stroud". BBC News Online. 19 April 2008. Retrieved 2009-09-10.
{{cite news}}: Italic or bold markup not allowed in:|publisher=(help) - ^ Harrison, Stephen (1998-04-30). "Close contest as Labour battles to stay in control Voters across the Midlands go to the polls next Thursdaymay7. Today, Local Government Correspondent Stephen Harrison looks at the looming ballot battle in Gloucestershire". Birmingham Post. p. 4.
{{cite news}}:|access-date=requires|url=(help) - ^ legislation.gov.uk - The District of Stroud (Electoral Arrangements) Order 1979. Retrieved on 19 November 2015.
- ^ legislation.gov.uk - The Gloucestershire Districts (Electoral Arrangements) Order 1991. Retrieved on 4 November 2015.
- ^ legislation.gov.uk - The Gloucestershire Districts (Electoral Arrangements) (Variation) Order 1991. Retrieved on 4 November 2015.
- ^ legislation.gov.uk - The Avon and Gloucestershire (County Boundaries) Order 1991. Retrieved on 5 November 2015.
- ^ legislation.gov.uk - The Gloucestershire (District Boundaries) Order 1991. Retrieved on 6 November 2015.
- ^ "Stroud". BBC News Online. Retrieved 2009-09-10.
{{cite news}}: Italic or bold markup not allowed in:|publisher=(help) - ^ legislation.gov.uk - The District of Stroud (Parishes and Electoral Changes) Order 2001. Retrieved on 4 October 2015.
- ^ legislation.gov.uk - The District of Stroud (Parishes and Electoral Changes) (Amendment) Order 2005. Retrieved on 3 November 2015.
- ^ legislation.gov.uk - The Stroud (Parish Electoral Arrangements and Electoral Changes) Order 2008. Retrieved on 3 November 2015.
- ^ legislation.gov.uk - The Stroud (Electoral Changes) Order 2015. Retrieved on 20 April 2016.
- ^ "Results of Cainscross District Ward By-Election 2005". Stroud District Council. Retrieved 2011-01-06.
{{cite web}}: Italic or bold markup not allowed in:|publisher=(help) - ^ "Results of Cainscross District Ward By-Election". Stroud District Council. Retrieved 2011-01-06.
{{cite web}}: Italic or bold markup not allowed in:|publisher=(help) - ^ "Nailsworth By Elections 2007". Stroud District Council. Retrieved 2009-09-10.
{{cite web}}: Italic or bold markup not allowed in:|publisher=(help) - ^ Mead, Chris (4 February 2011). "Labour celebrates council by-election breakthrough". The Independent. Retrieved 4 February 2011.
- ^ "Declaration of result of poll" (PDF). Stroud District Council. Retrieved 4 February 2011.


