
Growth chart: Difference between revisions
added header |
Asilvaalex4 (talk | contribs) No edit summary |
||
| Line 12: | Line 12: | ||
== Quantitative Definitions == |
== Quantitative Definitions == |
||
'''Mid-parental height (MPH)''' is a quantity used to predict the target height of an individual based on the heights of the two biological parents. It can be used to calculate the '''target height (TH)''' for children assigned male (AMAB) or female (AFAB) at birth. |
'''Mid-parental height (MPH)''' is a quantity used to predict the target height of an individual based on the heights of the two biological parents. It can be used to calculate the '''target height (TH)''' for children assigned male (AMAB) or female (AFAB) at birth<ref>{{Cite journal|last=Barstow|first=Craig|last2=Rerucha|first2=Caitlyn M.|date=2015-07-01|title=Evaluation of Short and Tall Stature in Children|url=https://www.aafp.org/afp/2015/0701/p43.html|journal=American Family Physician|volume=92|issue=1|pages=43–50|issn=0002-838X}}</ref>. |
||
* MPH = <math>mean(ParentHeight_1, ParentHeight_2)</math> |
* MPH = <math>mean(ParentHeight_1, ParentHeight_2)</math> |
||
* TH for AFAB = <math>MPH - 6.5 cm</math> |
* TH for AFAB = <math>MPH - 6.5 cm</math> |
||
* TH for AMAB = <math>MPH + 6.5 cm</math> |
* TH for AMAB = <math>MPH + 6.5 cm</math> |
||
'''Velocity''' is another quantity that is used to quantify growth curves. It can be used for both height and weight. If '''q''' represents the quantity of either weight or height, '''t''' represents time, and '''Δ''' represents change over a defined interval, then growth velocity can be defined as follows. |
'''Velocity''' is another quantity that is used to quantify growth curves. It can be used for both height and weight. If '''q''' represents the quantity of either weight or height, '''t''' represents time, and '''Δ''' represents change over a defined interval, then growth velocity can be defined as follows<ref>{{Citation|last=Bozzola|first=Mauro|title=Growth Velocity Curves: What They Are and How to Use Them|date=2012|url=http://link.springer.com/10.1007/978-1-4419-1795-9_180|work=Handbook of Growth and Growth Monitoring in Health and Disease|pages=2999–3011|editor-last=Preedy|editor-first=Victor R.|place=New York, NY|publisher=Springer New York|language=en|doi=10.1007/978-1-4419-1795-9_180|isbn=978-1-4419-1794-2|access-date=2021-09-13|last2=Meazza|first2=Cristina}}</ref>. |
||
* <math>velocity = \Delta q/\Delta t</math> |
* <math>velocity = \Delta q/\Delta t</math> |
||
Revision as of 18:16, 13 September 2021
Overview
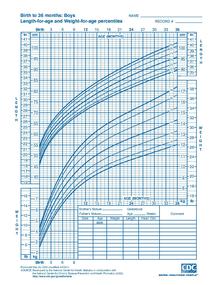
A growth chart is used by pediatricians and other health care providers to follow a child's growth over time. Growth charts have been constructed by observing the growth of large numbers of healthy children over time. The height, weight, and head circumference of a child can be compared to the expected parameters of children of the same age and sex to determine whether the child is growing appropriately. Growth charts can also be used to predict the expected adult height and weight of a child because, in general, children maintain a fairly constant growth curve. When a child deviates from his or her previously established growth curve, investigation into the cause is generally warranted. Parameters used to analyze growth charts include weight velocity (defined as rate of change in weight over time), height velocity (defined as rate of change in stature over time), and whether someone's growth chart crosses percentiles. For instance, a decrease in the growth velocity may indicate the onset of a chronic illness such as inflammatory bowel disease. Growth charts can also be compiled with a portion of the population deemed to have been raised in more or less ideal environments, such as nutrition that conforms to pediatric guidelines, and no maternal smoking. Charts from these sources end up with slightly taller but thinner averages.[1]
.jpg)
Growth charts are different for persons assigned male at birth and female at birth, due in part to pubertal differences and disparity in final adult height. In addition, children with chromosomal abnormalities such as Down syndrome and Turner syndrome follow distinct growth curves which deviate significantly from children without these conditions. As such, growth charts have been created to describe the expected growth patterns of several genetic conditions. Since there are differences in normal growth rates between breastfed and formula-fed babies,[2] the World Health Organization growth charts, which better reflect the growth pattern of the healthy, breastfed infant are considered the standard for U.S. children under age two.[3]
The growth chart was first developed by the National Center for Health Statistics (NCHS) in 1977 to clinically analyze child development. The 1977 growth chart was subsequently used by the World Health Organization for dissemination to healthcare systems abroad. Data used to calculate growth chart percentiles was accumulated periodically since the 1960's by the National Health and Nutrition Examination Survey. Updated and more comprehensive data was later used to revise the existing growth chart and construct the 2000 CDC growth charts. The revised growth charts include revision of the 14 existing charts as well as introduction of 2 new BMI-for-age charts.[4]
Quantitative Definitions
Mid-parental height (MPH) is a quantity used to predict the target height of an individual based on the heights of the two biological parents. It can be used to calculate the target height (TH) for children assigned male (AMAB) or female (AFAB) at birth[5].
- MPH =
- TH for AFAB =
- TH for AMAB =


Velocity is another quantity that is used to quantify growth curves. It can be used for both height and weight. If q represents the quantity of either weight or height, t represents time, and Δ represents change over a defined interval, then growth velocity can be defined as follows[6].

Bone age is another useful metric that complements a physician's use of a growth chart. It is particularly useful in working up growth abnormalities and can indicate a delay in onset of puberty.
Clinical Significance
See also
- Failure to thrive, a growth disorder
- Weight and height percentile
References
- ^ "WHO Child Growth Standards" (PDF). World Health Organization.
- ^ Dewey, KG; Peerson, JM; Brown, KH; Krebs, NF; Michaelsen, KF; Persson, LA; Salmenpera, L; Whitehead, RG; Yeung, DL (1995). "Growth of breast-fed infants deviates from current reference data: A pooled analysis of US, Canadian, and European data sets. World Health Organization Working Group on Infant Growth". Pediatrics. 96 (3 Pt 1): 495–503. PMID 7651784.
- ^ "Use of World Health Organization and CDC Growth Charts for Children Aged 0–59 Months in the United States" (PDF). Centers for Disease Control.
- ^ Centers for Disease Control. "CDC Growth Charts: United States".
{{cite web}}: CS1 maint: url-status (link) - ^ Barstow, Craig; Rerucha, Caitlyn M. (2015-07-01). "Evaluation of Short and Tall Stature in Children". American Family Physician. 92 (1): 43–50. ISSN 0002-838X.
- ^ Bozzola, Mauro; Meazza, Cristina (2012), Preedy, Victor R. (ed.), "Growth Velocity Curves: What They Are and How to Use Them", Handbook of Growth and Growth Monitoring in Health and Disease, New York, NY: Springer New York, pp. 2999–3011, doi:10.1007/978-1-4419-1795-9_180, ISBN 978-1-4419-1794-2, retrieved 2021-09-13