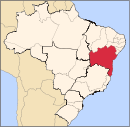
Morro do Chapéu

Morro do Chapéu is a municipality in the Brazilian state of Bahia, 386 km northwest of its capital, Salvador, 1012 meters above the sea level, because of which it is one of the coolest towns in Bahia, with temperatures occasionally falling below 10 °C in the winter. Its estimated population in 2020 is 35,440.[1]
Overview[edit]
The municipality contains the 46,000 hectares (110,000 acres) Morro do Chapéu State Park, created in 1998.[2] Standing at Chapada Diamantina region, its main attractions are Ferro Doido [1] waterfall and Brejões cave, both among the most beautiful natural monuments in Bahia, but are almost unexplored by tourists given to the city's lack of infrastructure. There are several other waterfalls and caves around the town.
Climate[edit]
Morro do Chapéu has a hot semi-arid climate (Köppen: BSh) with warm summers and mild, dry winters.
| Climate data for Morro do Chapéu (1991–2020) | |||||||||||||
|---|---|---|---|---|---|---|---|---|---|---|---|---|---|
| Month | Jan | Feb | Mar | Apr | May | Jun | Jul | Aug | Sep | Oct | Nov | Dec | Year |
| Mean daily maximum °C (°F) | 28.1 (82.6) |
28.3 (82.9) |
28.1 (82.6) |
26.7 (80.1) |
25.0 (77.0) |
23.4 (74.1) |
22.9 (73.2) |
23.8 (74.8) |
25.9 (78.6) |
27.8 (82.0) |
27.6 (81.7) |
27.9 (82.2) |
26.3 (79.3) |
| Daily mean °C (°F) | 22.3 (72.1) |
22.5 (72.5) |
22.5 (72.5) |
21.6 (70.9) |
20.2 (68.4) |
18.7 (65.7) |
17.9 (64.2) |
18.3 (64.9) |
19.7 (67.5) |
21.4 (70.5) |
21.8 (71.2) |
22.2 (72.0) |
20.8 (69.4) |
| Mean daily minimum °C (°F) | 18.2 (64.8) |
18.4 (65.1) |
18.6 (65.5) |
18.2 (64.8) |
17.1 (62.8) |
15.8 (60.4) |
14.9 (58.8) |
14.8 (58.6) |
15.7 (60.3) |
17.0 (62.6) |
17.7 (63.9) |
18.0 (64.4) |
17.0 (62.6) |
| Average precipitation mm (inches) | 82.1 (3.23) |
71.2 (2.80) |
80.7 (3.18) |
57.9 (2.28) |
28.2 (1.11) |
34.8 (1.37) |
29.9 (1.18) |
24.6 (0.97) |
18.0 (0.71) |
33.8 (1.33) |
93.1 (3.67) |
71.4 (2.81) |
625.7 (24.63) |
| Average precipitation days (≥ 1.0 mm) | 6.1 | 5.6 | 6.2 | 7.2 | 7.8 | 9.4 | 8.6 | 6.8 | 4.9 | 3.5 | 6.5 | 5.9 | 78.5 |
| Average relative humidity (%) | 69.5 | 70.4 | 72.3 | 77.2 | 80.2 | 82.5 | 80.8 | 75.7 | 70.6 | 65.8 | 69.2 | 69.6 | 73.7 |
| Average dew point °C (°F) | 17.1 (62.8) |
17.4 (63.3) |
17.7 (63.9) |
17.8 (64.0) |
17.0 (62.6) |
16.0 (60.8) |
14.9 (58.8) |
14.5 (58.1) |
14.8 (58.6) |
15.5 (59.9) |
16.5 (61.7) |
17.0 (62.6) |
16.4 (61.5) |
| Mean monthly sunshine hours | 225.7 | 201.4 | 217.3 | 193.0 | 173.8 | 162.3 | 186.3 | 215.7 | 215.9 | 230.6 | 193.2 | 213.2 | 2,428.4 |
| Source: NOAA[3] | |||||||||||||
References[edit]
- ^ IBGE 2020
- ^ PES Morro do Chapéu (in Portuguese), ISA: Instituto Socioambiental, retrieved 2017-01-21
- ^ "World Meteorological Organization Climate Normals for 1991-2020 — Morro do Chapéu". National Oceanic and Atmospheric Administration. Retrieved January 31, 2024.


