
2002 Swedish general election
| ||||||||||||||||||||||||||||||||||||||||||||||||||||||||||||||||||||||||||||||||||||||||||||||||||||||||||||||||||||||||||||||||||
All 349 seats in the Riksdag 175 seats needed for a majority | ||||||||||||||||||||||||||||||||||||||||||||||||||||||||||||||||||||||||||||||||||||||||||||||||||||||||||||||||||||||||||||||||||
|---|---|---|---|---|---|---|---|---|---|---|---|---|---|---|---|---|---|---|---|---|---|---|---|---|---|---|---|---|---|---|---|---|---|---|---|---|---|---|---|---|---|---|---|---|---|---|---|---|---|---|---|---|---|---|---|---|---|---|---|---|---|---|---|---|---|---|---|---|---|---|---|---|---|---|---|---|---|---|---|---|---|---|---|---|---|---|---|---|---|---|---|---|---|---|---|---|---|---|---|---|---|---|---|---|---|---|---|---|---|---|---|---|---|---|---|---|---|---|---|---|---|---|---|---|---|---|---|---|---|---|
| ||||||||||||||||||||||||||||||||||||||||||||||||||||||||||||||||||||||||||||||||||||||||||||||||||||||||||||||||||||||||||||||||||


| ||||||||||||||||||||||||||||||||||||||||||||||||||||||||||||||||||||||||||||||||||||||||||||||||||||||||||||||||||||||||||||||||||
| ||||||||||||||||||||||||||||||||||||||||||||||||||||||||||||||||||||||||||||||||||||||||||||||||||||||||||||||||||||||||||||||||||
_(7)_(cropped).jpg)
_(cropped).jpg)
_(cropped).jpg)


General elections were held in Sweden on 15 September 2002,[1] alongside municipal and county council elections. The Swedish Social Democratic Party remained the largest party in the Riksdag, winning 144 of the 349 seats.[2]
After securing a confidence and supply agreement with the Left Party and the Green Party, Prime Minister Göran Persson was able to remain in his position for a third consecutive term as a minority government.
Although the bloc compositions were similar to 1998, the complexions of the centre-right bloc shifted radically. Under new party leader Bo Lundgren, the Moderates lost more than seven percentage points and barely held on as the largest party in its coalition. Only eight municipalities in all of Sweden had the Moderates as the largest party, six of which were in the Stockholm area.[3] The Peoples' Party led by Lars Leijonborg, instead more than doubled its parliamentary delegation and received above 13% of the vote. Lundgren resigned in the wake of the election, leading to the selection of future Prime Minister Fredrik Reinfeldt as the Moderate leader.
Among the four other Riksdag parties, the Christian Democrats and the Left Party both lost ground, whereas the Centre and Green parties managed to reach the parliamentary threshold of four percentage points.
Among minor parties, the Norrbotten Party reached 9.4% of the vote in its county, polling above 20% in some inland areas. However, this was not enough to gain a Riksdag seat.[3] The Sweden Democrats became the eight largest party for the first time, making sizeable gains and winning more council seats than ever before.
Debates
[edit]| 2002 Swedish general election debates | |||||||||||
|---|---|---|---|---|---|---|---|---|---|---|---|
| Date | Time | Organizers | Moderators | P Present I Invitee N Non-invitee | |||||||
| S | M | V | KD | C | L | MP | Refs | ||||
| Sveriges Television | Stina Lundberg | P Göran Persson |
P Bo Lundgren |
P Gudrun Schyman |
P Alf Svensson |
P Maud Olofsson |
P Lars Leijonborg |
P Peter Eriksson |
[4] | ||
Results
[edit] | |||||
|---|---|---|---|---|---|
| Party | Votes | % | Seats | +/– | |
| Swedish Social Democratic Party | 2,113,560 | 39.85 | 144 | +13 | |
| Moderate Party | 809,041 | 15.26 | 55 | −27 | |
| Liberal People's Party | 710,312 | 13.39 | 48 | +31 | |
| Christian Democrats | 485,235 | 9.15 | 33 | −9 | |
| Left Party | 444,854 | 8.39 | 30 | −13 | |
| Centre Party | 328,428 | 6.19 | 22 | +4 | |
| Green Party | 246,392 | 4.65 | 17 | +1 | |
| Sweden Democrats | 76,300 | 1.44 | 0 | 0 | |
| Swedish Senior Citizen Interest Party | 37,573 | 0.71 | 0 | 0 | |
| Norrbotten Party | 14,854 | 0.28 | 0 | – | |
| New Future | 9,337 | 0.18 | 0 | 0 | |
| Scania Party | 4,564 | 0.09 | 0 | – | |
| National Democrats | 4,122 | 0.08 | 0 | – | |
| Socialist Party | 3,213 | 0.06 | 0 | 0 | |
| Socialist Justice Party | 1,519 | 0.03 | 0 | 0 | |
| Communist Party | 1,182 | 0.02 | 0 | 0 | |
| Unity | 603 | 0.01 | 0 | 0 | |
| Free List | 274 | 0.01 | 0 | – | |
| Voice of the Free People | 207 | 0.00 | 0 | – | |
| European Workers Party | 163 | 0.00 | 0 | – | |
| New Democracy | 106 | 0.00 | 0 | 0 | |
| Welfare Party | 94 | 0.00 | 0 | – | |
| National Democratic Party | 87 | 0.00 | 0 | – | |
| Alliance Party | 58 | 0.00 | 0 | – | |
| Skåne Federalists | 52 | 0.00 | 0 | – | |
| Communist League | 46 | 0.00 | 0 | – | |
| Citizens Party | 27 | 0.00 | 0 | – | |
| National Householders | 17 | 0.00 | 0 | – | |
| Republicans | 15 | 0.00 | 0 | – | |
| Tax Reformists | 14 | 0.00 | 0 | – | |
| Popular Democrats | 12 | 0.00 | 0 | – | |
| New Swedes D.P.N.S. | 11 | 0.00 | 0 | – | |
| Donald Duck Party | 10 | 0.00 | 0 | – | |
| Party of Love | 8 | 0.00 | 0 | – | |
| Populist Party | 8 | 0.00 | 0 | – | |
| Blank Voters Party-A Political Marking | 7 | 0.00 | 0 | – | |
| Sports Party | 7 | 0.00 | 0 | – | |
| Preschool Party - Children's Voice | 6 | 0.00 | 0 | – | |
| God-Trolls-Witches-Beings and Cosmic Powers Party | 4 | 0.00 | 0 | – | |
| ATP Pensions And Widows' Pensions Party | 4 | 0.00 | 0 | – | |
| Singles Party-Sorry, but we exist too | 3 | 0.00 | 0 | – | |
| Cloning, no Thanks I am a Unique Person Party | 3 | 0.00 | 0 | – | |
| Animal Welfare Party-A Loving Life for our Animals | 3 | 0.00 | 0 | – | |
| Beach Protection Party | 3 | 0.00 | 0 | – | |
| Viking Party-Sweden Out of the EU | 2 | 0.00 | 0 | – | |
| Dog Party-The Dog, Man's Best Friend | 2 | 0.00 | 0 | – | |
| Shaman's Indigenous Party | 2 | 0.00 | 0 | – | |
| Crisis | 1 | 0.00 | 0 | – | |
| Dust Online | 1 | 0.00 | 0 | – | |
| Santa Party: Children's and Animals' Best Friend | 1 | 0.00 | 0 | – | |
| Dentist High Cost Party | 1 | 0.00 | 0 | – | |
| Land we Inherited Party | 1 | 0.00 | 0 | – | |
| The Boiled Frog Dance Party. The Swedish Man Today | 1 | 0.00 | 0 | – | |
| Football Party | 1 | 0.00 | 0 | – | |
| Other parties | 10,861 | 0.20 | 0 | – | |
| Total | 5,303,212 | 100.00 | 349 | 0 | |
| Valid votes | 5,303,212 | 98.47 | |||
| Invalid/blank votes | 82,218 | 1.53 | |||
| Total votes | 5,385,430 | 100.00 | |||
| Registered voters/turnout | 6,722,152 | 80.11 | |||
| Source: Val | |||||
Seat distribution
[edit]| Constituency | Total seats |
Seats won | |||||||||
|---|---|---|---|---|---|---|---|---|---|---|---|
| By party | By coalition | ||||||||||
| S | M | F | KD | V | C | MP | Red-green | Right | |||
| Blekinge | 6 | 3 | 1 | 1 | 1 | 3 | 3 | ||||
| Dalarna | 11 | 5 | 1 | 1 | 1 | 1 | 1 | 1 | 7 | 4 | |
| Gävleborg | 11 | 5 | 1 | 1 | 1 | 1 | 1 | 1 | 7 | 4 | |
| Gothenburg | 18 | 6 | 3 | 4 | 2 | 2 | 1 | 9 | 9 | ||
| Gotland | 2 | 2 | 2 | ||||||||
| Halland | 11 | 4 | 2 | 2 | 1 | 1 | 1 | 5 | 6 | ||
| Jämtland | 6 | 3 | 1 | 1 | 1 | 4 | 2 | ||||
| Jönköping | 13 | 5 | 2 | 1 | 3 | 1 | 1 | 6 | 7 | ||
| Kalmar | 9 | 4 | 1 | 1 | 1 | 1 | 1 | 5 | 4 | ||
| Kronoberg | 7 | 3 | 1 | 1 | 1 | 1 | 3 | 4 | |||
| Malmö | 9 | 5 | 2 | 1 | 1 | 6 | 3 | ||||
| Norrbotten | 11 | 6 | 1 | 1 | 1 | 1 | 1 | 8 | 3 | ||
| Örebro | 11 | 5 | 1 | 1 | 1 | 1 | 1 | 1 | 7 | 4 | |
| Östergötland | 17 | 7 | 3 | 2 | 2 | 1 | 1 | 1 | 9 | 8 | |
| Skåne North and East | 11 | 5 | 2 | 1 | 1 | 1 | 1 | 6 | 5 | ||
| Skåne South | 14 | 5 | 3 | 2 | 1 | 1 | 1 | 1 | 7 | 7 | |
| Skåne West | 10 | 4 | 2 | 2 | 1 | 1 | 5 | 5 | |||
| Södermanland | 11 | 5 | 1 | 1 | 1 | 1 | 1 | 1 | 7 | 4 | |
| Stockholm County | 39 | 13 | 9 | 8 | 3 | 3 | 1 | 2 | 18 | 21 | |
| Stockholm Municipality | 29 | 9 | 7 | 6 | 2 | 3 | 2 | 14 | 15 | ||
| Uppsala | 12 | 4 | 2 | 2 | 1 | 1 | 1 | 1 | 6 | 6 | |
| Värmland | 11 | 5 | 1 | 1 | 1 | 1 | 1 | 1 | 7 | 4 | |
| Västerbotten | 11 | 5 | 1 | 1 | 1 | 1 | 1 | 1 | 7 | 4 | |
| Västernorrland | 10 | 5 | 1 | 1 | 1 | 1 | 1 | 6 | 4 | ||
| Västmanland | 10 | 5 | 1 | 1 | 1 | 1 | 1 | 6 | 4 | ||
| Västra Götaland East | 9 | 4 | 1 | 1 | 1 | 1 | 1 | 5 | 4 | ||
| Västra Götaland North | 10 | 4 | 1 | 1 | 1 | 1 | 1 | 1 | 6 | 4 | |
| Västra Götaland South | 7 | 3 | 1 | 1 | 1 | 1 | 3 | 4 | |||
| Västra Götaland West | 13 | 5 | 2 | 2 | 1 | 1 | 1 | 1 | 7 | 6 | |
| Total | 349 | 144 | 55 | 48 | 33 | 30 | 22 | 17 | 191 | 158 | |
| Source: Statistics Sweden | |||||||||||
By municipality
[edit]-
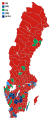 Votes by municipality. The municipalities are the color of the party that got the most votes within the coalition that won relative majority.
 -
 Cartogram of the map to the left with each municipality rescaled to the number of valid votes cast.
 -
 Map showing the voting shifts from the 1998 to the 2002 election. Darker blue indicates a municipality voted more towards the parties that formed the centre-right bloc. Darker red indicates a municipality voted more towards the parties that form the left-wing bloc.
 -
 Votes by municipality as a scale from red/Left-wing bloc to blue/Centre-right bloc.
 -
 Cartogram of vote with each municipality rescaled in proportion to number of valid votes cast. Deeper blue represents a relative majority for the centre-right coalition, brighter red represents a relative majority for the left-wing coalition.


References
[edit]- ^ Nohlen, D & Stöver, P (2010) Elections in Europe: A data handbook, p1858 ISBN 978-3-8329-5609-7
- ^ Nohlen & Stöver, p1873
- ^ a b "Sverige - Valområde - 2002-09-27 09:16:45" (in Swedish). Valmyndigheten. 27 September 2002. Archived from the original on 7 September 2021. Retrieved 19 November 2019.
- ^ Slutdebatter – Val 2002: Slutdebatten (in Swedish), retrieved 1 February 2024 – via Sveriges Television AB, Stockholm
Further reading
[edit]- Madeley, John T. S. (April 2003). "'The Swedish model is dead! Long live the Swedish model!' The 2002 Riksdag election". West European Politics. 26 (2): 165–173. doi:10.1080/01402380512331341161.
| General elections | |
|---|---|
| Local elections | |
| European elections | |
| Referendums | |