
Species distribution: Difference between revisions
| Line 18: | Line 18: | ||
==Random distribution== |
==Random distribution== |
||
Random distribution is the least common form of distribution in nature. The members of a species are found in homogenous environments, with no observable placing scheme. This type of distribution is also referred to as unpredictable spacing. The position of each individual is independent of the other individuals: they neither attract nor repel one another. Random distribution is |
Random distribution is the least common form of distribution in nature. The members of a given species in random distribution are found in homogenous environments, with no observable placing scheme. This type of distribution is also referred to as unpredictable spacing. The position of each individual is independent of the other individuals: they neither attract nor repel one another. Random distribution is rare in nature due to biotic and abiotic factors that can cause organisms to be close together or far apart. Biotic factors such as the interactions with neighboring individuals, or abiotic factors such as the climate or soil conditions, cause the distribution to vary. <ref>Vliet,Kent. Intergrated Principles of Biology lab manual</ref> Random distribution usually occurs in habitats where environmental conditions and resources are consistent. In this pattern of dispersion there are no strong social interactions between species.<ref>{{cite book | last = Avila | first = Vernon L | title = Biology: Investigating Life on Earth | publisher = Jones & Bartlett Publishers | date = 1995 | pages = 855}}</ref> For Example; When [[dandelion]] [[seeds]] are dispersed by wind, random distribution will often occur as the seedlings land in random places determined by uncontrollable factors. Tropical fig trees exhibit this type of dispersal as well. In addition to tropical fig trees and dandelion seeds, Oyster larvae can travel hundreds of kilometers powered by sea currents, which causes random distribution when the larvae land in random places. |
||
== Abiotic and Biotic factors == |
== Abiotic and Biotic factors == |
||
Revision as of 20:25, 8 April 2009

Species distribution is the manner in which groups of species are spread out. Species distribution is not to be confused with dispersal which is the movement of individuals away from their area of origin or from centers of high population density. There are three distinct types: clumped, uniform, and random. A similar concept is the species range, which focuses more on the factors determining a species' distribution. It is important to note that the pattern of distribution is not permanent for each species. Distribution patterns can change seasonally, in response to the availability of resources, and also depending on the scale at which they are viewed. Distribution usually takes place at the time of reproduction. Populations within a species are translocated through many methods, including dispersal by people, wind, water, and animals. People are one of the largest distributors due to the current trends in globalization and the expanse of the transportation industry. For example, large tankers often fill their ballasts with water at one port and empty them in another, causing a wider distribution of aquatic species.
Biogeography, or the study of the distribution of biodiversity over space and time, is very useful in understanding species distribution through factors such as, but not limited to, speciation, extinction, continental drift, glaciation, variation of sea levels, river capture, and available resources. This branch of study not only gives a description of the species distribution, but also a geographical explanation for the distribution of particular species.
Clumped distribution
Clumped distribution is the most common type of dispersion found in nature in which the distance between neighboring individuals is minimized. This type of distribution is found in environments that are characterized by patchy resources. Individuals might be clustered together in an area due to social factors such as selfish herds and family groups, like wolves in packs. Organisms that usually serve as prey form clumped distributions in areas where they can hide and detect predators easily. Other causes of clumped distribution are the inability of offspring to independently move from its habitat. This is seen in baby animals that are immobile and strongly dependent upon its parent. For example, the bald eagle's nest of eaglets exhibits a clumped species distribution because all the offspring are in a target area before they learn to fly. Clumped distribution in species acts as a mechanism against predation as well as an efficient mechanism to trap or corner prey. African wild dogs, Lycaon pictus, use the technique of communal hunting to increase their success rate at catching prey. It has also been shown that larger packs of African wild dogs tend to have a greater number of successful kills. A prime example of clumped distribution due to patchy resources is the wildlife in Africa during the dry season; lions, hyenas, giraffes, elephants, gazelles, and many more animals are clumped by small water sources that are present in the severe dry season. [1]
Uniform distribution
Less common than clumped distribution, uniform distribution is evenly spaced. This type of distribution is also known as even distribution. Uniform distributions are distributions in which the distance between neighboring individuals is maximized. This type of pattern may result from direct social interactions between individuals in the population, such as territoriality. For example, penguins often exhibit uniform spacing by aggressively defending their territory among their neighbors. Plants also exhibit uniform distributions, like the creosote bushes in the southwestern region of the United States. Salvia leucophylla is a species in California that naturally grows in uniform spacing. This flower releases chemicals called terpenes which inhibit the growth of other plants around it and results in uniform distribution.[2] This is an example of allelopathy, which is the release of chemicals from plant parts by leaching, root exudation, volatilization, residue decomposition and other processes. Allelopathy can have beneficial, harmful, or neutral effects on surrounding organisms. Some allelochemicals even have selective affects on surrounding organisms; for example, the tree species Leucaena leucocephala exudes a chemical that inhibits the growth of other plants but not those of its own species, and it has also been shown to decrease wheat growth though it increases rice yield. Allelopathy usually results in uniform distributions, and its potential to suppress weeds is being researched.[3] The need to maximize the space between individuals generally arises from competition for a resource such as moisture or nutrients.
Random distribution
Random distribution is the least common form of distribution in nature. The members of a given species in random distribution are found in homogenous environments, with no observable placing scheme. This type of distribution is also referred to as unpredictable spacing. The position of each individual is independent of the other individuals: they neither attract nor repel one another. Random distribution is rare in nature due to biotic and abiotic factors that can cause organisms to be close together or far apart. Biotic factors such as the interactions with neighboring individuals, or abiotic factors such as the climate or soil conditions, cause the distribution to vary. [4] Random distribution usually occurs in habitats where environmental conditions and resources are consistent. In this pattern of dispersion there are no strong social interactions between species.[5] For Example; When dandelion seeds are dispersed by wind, random distribution will often occur as the seedlings land in random places determined by uncontrollable factors. Tropical fig trees exhibit this type of dispersal as well. In addition to tropical fig trees and dandelion seeds, Oyster larvae can travel hundreds of kilometers powered by sea currents, which causes random distribution when the larvae land in random places.
Abiotic and Biotic factors
The distribution of species distributions into clumped, uniform, or random has to do with different abiotic and biotic factors. Any non-living chemical or physical factor in the environment is considered an abiotic factor. There are three main types of abiotic factors: Climatic factors consist of sunlight, atmosphere, humidity, temperature, and salinity; Edaphic factors are abiotic factors regarding soil, such as the coarseness of soil, local geology, soil pH, and aeration; and Social factors include land use and water availability. An example of the effects of abiotic factors on species distribution can be seen in drier areas, where most individuals of a species will gather around water sources, forming a clumped distribution.
Biotic factors, such as predation, disease, and competition for resources such as food, water, and mates, can also affect how the species is distributed. A biotic factor is any behavior of an organism that affects another organism, such as a predator consuming its prey. For example, biotic factors in a quail’s environment would include their prey (insects and seeds), Competition from other quail, and their predators, such as the coyote.[6] An advantage of a herd, community, or other clumped distribution allows a population to detect predators earlier, at a greater distance, and potentially mount an effective defense. Due to limited resources, populations may be evenly distributed to minimize competition[7], as is found in forests, where competition for sunlight produces an even distribution of trees.[8]
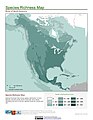
Species Distribution Grids Project
The Species Distribution Grids Project is an effort led out of the University of Columbia to create maps and databases of the whereabouts of various animal species. This work is centered on preventing deforestation and prioritizing areas based on species richness.[9] As of April 2009, data are available for global amphibian distributions, and for birds and mammals in the Americas.[10] The map gallery [1] contains sample maps for the Species Grids data set. These maps are not inclusive. They contain a representative sample of the types of data available for download. Here are some examples:
-
 Species Richness Map (Amphibians)
 -
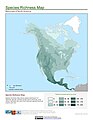
 Species Richness Map (Birds)
 -
 Species Richness Map (Mammals)


Statistical determination of distribution patterns
There are various ways to determine the distribution pattern of species. The Clark-Evans nearest neighbor method can be used to determine if a distribution is clumped, uniform or random.[11] To utilize the Clark-Evans nearest neighbor method, researchers examine a population of a single species. The distance of an individual to its nearest neighbor is recorded for each individual in the sample. For two individual that are each other's nearest neighbor, the distance is recorded twice, once for each individual. To receive accurate results, it is suggested that the number of distance measurements is at least 50. The average distance between nearest neighbors is compared to the expected distance in the case of random distribution to give the ratio:

If this ratio (R) is equal to 1, then the population is randomly dispersed. If R is significantly greater than 1, the population is evenly dispersed. Lastly, if R is significantly less than 1, the population is clumped. Statistical tests (such as t-test, chi squared, etc.) can then be used to determine whether R is significantly different from 1. An example of this method can be found in examining a population of a local variety of flowers to determine the type of its distribution.
The Variance/Mean ratio method focuses mainly on determining whether a species fits a randomly spaced distribution, but can also be used as evidence for either an even or clumped distribution.[12] To utilize the Variance/Mean ratio method, data is collected from several random samples of a given population. In this analysis, it is imperative that data from at least 50 sample plots is considered. The number of individuals present in each sample is compared to the expected counts in the case of random distribution. The expected distribution can be found using Poisson distribution. If the variance/mean ratio is equal to 1, the population is found to be randomly distributed. If it is significantly greater than 1, the population is found to be clumped distribution. Finally, if the ratio is significantly less than 1, the population is found to be evenly distributed. Again, statistical tests (t-test, chi squared, etc.) can be used to find the significance of the variance/mean ratio.
However, many researchers believe that species distribution models based on statistical analysis without including ecological models and theories are too incomplete for prediction. Instead of conclusions based on presence-absence data, probabilities that convey the likelihood a species will occupy a given area is more preferred because these models include an estimate of confidence in the likelihood of the species being present/absent. Additionally, they are also more valuable than data collected based on simple presence or absence because models based on probability allow the formation of spatial maps that indicates how likely a species is to be found in a particular area. Similar areas can then be compared to see how likely it is that a species will occur there also; this leads to a relationship between habitat suitability and species occurrence. [13]
See also
Notes
- ^ Template:Cite article
- ^ Mauseth, James (2008). Botany: An Introduction to Plant Biology. Johns and Bartlett Publishers. p. 596. ISBN 0763753459.
- ^ Fergusen, J.J (2003). "Allelopathy: How Plants Suppress Other Plants". Retrieved 2009-04-06.
{{cite web}}: Unknown parameter|coauthors=ignored (|author=suggested) (help) - ^ Vliet,Kent. Intergrated Principles of Biology lab manual
- ^ Avila, Vernon L (1995). Biology: Investigating Life on Earth. Jones & Bartlett Publishers. p. 855.
- ^ http://www.biology-online.org/dictionary/Biotic_factor
- ^ Campbell, Reece. Biology. eight edition
- ^ http://www.biology-online.org/dictionary/Abiotic_factor
- ^ http://www.earthsky.org/radioshows/52945/malanding-jaiteh-on-where-species-live
- ^ http://sedac.ciesin.columbia.edu/species/spTextFilter.jsf
- ^ Blackith, R. E. (1958). Nearest-Neighbour Distance Measurements for the Estimation of Animal Populations. Ecology. pp. 147–150.
- ^ Banerjee, B. (1976). Variance to mean ratio and the spatial distribution of animals. Birkhäuser Basel. pp. 993–994.
- ^ Ormerod, S.J. (2005). "The continuing challenges of testing species distribution models". Journal of Applied Ecology. 42 (4): 720–730.
{{cite journal}}: Unknown parameter|coauthors=ignored (|author=suggested) (help)