
Geostatistics
This article needs attention from an expert in Geography. Please add a reason or a talk parameter to this template to explain the issue with the article. (November 2008) |
Geostatistics is a branch of Geology that deals with the analysis of mining processes through mathematical models. Evolved originally in the exploration of minerals, ores, and coals, it is currently applied in disciplines such as petroleum geology, hydrogeology, hydrology, meteorology, oceanography, geochemistry, geography, forestry, environmental control, landscape ecology, agriculture (esp. in precision farming).
Geostatistics explains not only its applications within Geographic Information Systems but also the numerous applications of mathematical analysis on varied spatial datasets, the most prominent being a digital elevation model, from which any number of analyses may be derived. Geostatistics is also applied in varied branches of human geography, particularly those involving the spread of disease (epidemiology), the practice of commerce and military planning (logistics), and the development of efficient spatial networks.
Background

Geographers study how and why elements differ from place to place, as well as how spatial patterns change through time. Geographers begin with the question 'Where?', exploring how features are distributed on a physical or cultural landscape, observing spatial patterns and the variation of phenomena. Contemporary geographical analysis has shifted to 'Why?', determining why a specific spatial pattern exists, what spatial or ecological processes may have affected a pattern, and why such processes operate. Only by approaching the 'why?' questions can social scientists begin to appreciate the mechanisms of change, which are infinite in their complexity.
When any phenomena is measured, the observation methodology will dictate the accuracy of subsequent analysis; in geography, this issue is complicated by unique variables and spatial patterns such as geospatial topology. An interesting feature in geostatistics is that every location displays some form of spatial pattern, whether in the form of the environment, climate, pollution, urbanization or human health. This is not to state that all variables are spatially dependent, simply that variables are incapable of measurement separate from their surroundings, such that there can be no perfect control population. Whether the study is concerned with the nature of traffic patterns in an urban core, or with the analysis of weather patterns over the Pacific, there are always variables which escape measurement; this is determined directly by the scale and distribution of the data collection, or survey, and its methodology. Limitations in data collection make it impossible to make a direct measure of continuous spatial data without inferring probabilities, some of these probability functions are applied to create an interpolation surface - predicting unmeasured variables at innumerable locations.
Role of statistics in geography
Statistical techniques and procedures are applied in all fields of academic research; wherever data are collected and summarized or wherever any numerical information is analyzed or research is conducted, statistics are needed for sound analysis and interpretation of results.
Geographers use statistics in numerous ways:
- To describe and summarize spatial data.
- To make generalizations concerning complex spatial patterns.
- To estimate the probability of outcomes for an event at a given location.
- To use samples of geographic data to infer characteristics for a larger set of geographic data (population).
- To determine if the magnitude or frequency of some phenomenon differs from one location to another.
- To learn whether an actual spatial pattern matches some expected pattern.
This is not a comprehensive list, and should not be interpreted as such.
Spatial data and descriptive statistics
There are several potential difficulties associated with the analysis of spatial data, among these are boundary delineation, modifiable areal units, and the level of spatial aggregation or scale. In each of these cases, the absolute descriptive statistics of an area - the mean, median, mode, standard deviation, and variation - are changed through the manipulation of these spatial problems.
Boundary delineation
The location of a study area boundary and the positioning of internal boundaries affect various descriptive statistics. With respect to measures such as the mean or standard deviation, the study area size alone may have large implications; consider a study of per capita income within a city, if confined to the inner city, income levels are likely to be lower because of a less affluent population, if expanded to include the suburbs or surrounding communities, income levels will become greater with the influence of homeowner populations. Because of this problem, absolute descriptive statistics such as the mean, standard deviation, and variance should be evaluated comparatively only in relation to a particular study area. In the determination of internal boundaries this is also true, as these statistics may only have valid interpretations for the area and subarea configuration over which they are calculated.
Modifiable areal units
See also: Modifiable areal unit problem
In many cases the subdivision of spatial data has already been determined, this is evident in demographic datasets, as the available information will be grouped into their respective counties or municipalities. For this type of data, analysts must use the same county or municipal boundaries delineated in the collected data for their subsequent analysis. When alternate boundaries are possible, an analyst must take into account that any new subdivision model may create different results.
Spatial aggregation/scale problem
Socio-economic data may be available at a variety of scales, for example: municipalities, regional districts, census tracts, enumeration districts, or at the provincial/state level. When this data is aggregated at different scales, the resulting descriptive statistics may exhibit variations, either in a systematic, predictable way, or in a more uncertain fashion. If we are observing economic data, we may notice a distinct reduction in manufacturing productivity for a country (the USA) over a certain period; since this is a general model, individual states may experience these effects differently. The result of this aggregation is that the standard deviation of the data in question is increased due to the variability among states.
Descriptive spatial statistics
For summarizing point pattern analysis, a set of descriptive spatial statistics has been developed that are areal equivalents to nonspatial measures. Since geographers are particularly concerned with the analysis of locational data, these descriptive spatial statistics (geostatistics) are often applied to summarize point patterns and to describe the degree of spatial variability of some phenomena.
Spatial measures of central tendency
- Mean center
- See also Mean center of U.S. population
The mean is an important measure of central tendency, which when extended to a set of points, located on a Cartesian coordinate system, the average location, or mean center, can be determined.
- The weighted mean center is analogous to frequencies in the calculation of grouped statistics, such as the weighted mean. A point may represent a retail outlet, while its frequency will represent the volume of sales within the particular store.
- Median center or Euclidean center
- See also Manhattan distance
Spatial measures of dispersion
- Standard distance
- Relative distance
Topology
- See main article Topology
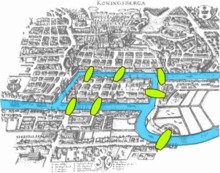
The Seven Bridges of Königsberg, one of the most famous problems in topology

The motivating insight behind topology is that some geometric problems depend not on the exact shape of the objects involved, but rather on the "way they are connected together". One of the first papers in topology was the demonstration, by Leonhard Euler, that it was impossible to find a route through the town of Königsberg (now Kaliningrad) that would cross each of its seven bridges exactly once. This result did not depend on the lengths of the bridges, nor on their distance from one another, but only on connectivity properties: which bridges are connected to which islands or riverbanks. This problem, the Seven Bridges of Königsberg, is now a famous problem in introductory mathematics, and led to the branch of mathematics known as graph theory.
Topology rules
- See main article Geospatial topology
Topology rules are particularly important within GIS, and are used for a variety of correction and analytical procedures. The primary shapes in GIS are the point, line, and polygon, each of which implies different spatial characteristics; for instance, the only shape which has a distinguishable inside and outside is the polygon. Principles of connectivity associated with topology lead to applications in hydrology, urban planning, and logistics, as well as other fields; as such, topological analyses offer unique modelling capabilities, defining the vector nature of topological features and correcting spatial data errors from digitizing.
Topography
This section needs expansion with: connection to the main topic. You can help by adding to it. (August 2008) |
- See main article Topography
Sampling methodology
This section needs expansion with: details. You can help by adding to it. (August 2008) |
- Statistical sampling
- Geospatial sampling
Criticism
Jan Merks, a mineral sampling expert consultant from Canada, has strongly criticized[1] geostatistics since 1992. Referring to it as "voodoo science"[2] and "scientific fraud", he claims that geostatistics is an invalid branch of statistics. Merks argues[3] that geostatistics
- ignores the variance of the distance-weighted average,
- ignores the concept of degrees of freedom of a data set when testing for spatial dependence by applying Fisher's F-test to the variance of a set and the first variance term of the ordered set,
- abuses statistics by not using analysis of variance properly,
- replaced genuine variances of single distance-weighted average grades with pseudo-variances of sets of distance-weighted average grades, violating the one-to-one correspondence between variances and functions such as Agterberg's distance-weighted average point grade.
Furthermore, Merks accuses geostatistics of enabling a significant inflation of mining reserve estimates, as in the case of Bre-X's fraud. Merks's expertise and credibility are supported by several company executives, who regularly hire his consulting services[4].
Even though some scholars join Merks in his criticism[5], the scientific community at large refuses to accept it, and continues to support geostatistics as a valuable scientific approach[6][7]. Nevertheless, there is a consensus that inappropriate use of geostatistics makes the method susceptible to erroneous reading of results[4][8].
Related software
- gslib is a set of fortran 77 routines (open source) implementing most of the classical geostatistics estimation and simulation algorithms
- sgems is a cross-platform (windows, unix), open-source software that implements most of the classical geostatistics algorithms (kriging, Gaussian and indicator simulation, etc) as well as new developments (multiple-points geostatistics). It also provides an interactive 3D visualization and offers the scripting capabilities of python.
- gstat is an open source computer code for multivariable geostatistical modelling, prediction and simulation. The gstat functionality is also available as an S extension, either as R package or S-Plus library.
- besides gstat, R has at least six other packages dedicated to geostatistics and other areas in spatial statistics.
Notes
- ^ A website that criticizes Matheronian geostatistics
- ^ See (Merks 1992)
- ^ See (Merks 1993)
- ^ a b Sandra Rubin, "Whistleblower raises doubts over ore bodies," Financial Post, September 30, 2002.
- ^ See (Philip and Watson 1986).
- ^ Discussion on Jan Merk's criticism at ai-geostat discussion group
- ^ A letter refuting the criticism
- ^ Statistics for Spatial Data, Revised Edition, Noel A. C. Cressie, ISBN 978-0-471-00255-0.
References
- Armstrong, M and Champigny, N, 1988, A Study on Kriging Small Blocks, CIM Bulletin, Vol 82, No 923
- Armstrong, M, 1992, Freedom of Speech? De Geeostatisticis, July, No 14
- Champigny, N, 1992, Geostatistics: A tool that works, The Northern Miner, May 18
- Clark I, 1979, Practical Geostatistics, Applied Science Publishers, London
- David, M, 1977, Geostatistical Ore Reserve Estimation, Elsevier Scientific Publishing Company, Amsterdam
- Hald, A, 1952, Statistical Theory with Engineering Applications, John Wiley & Sons, New York
- Chilès, J.P., Delfiner, P. 1999. Geostatistics: modelling spatial uncertainty, Wiley Series in Probability and Mathematical Statistics, 695 pp.
- Deutsch, C.V., Journel, A.G, 1997. GSLIB: Geostatistical Software Library and User's Guide (Applied Geostatistics Series), Second Edition, Oxford University Press, 369 pp., http://www.gslib.com/
- Deutsch, C.V., 2002. Geostatistical Reservoir Modeling, Oxford University Press, 384 pp., http://www.statios.com/WinGslib/index.html
- Isaaks, E.H., Srivastava R.M.: Applied Geostatistics. 1989.
- ISO/DIS 11648-1 Statistical aspects of sampling from bulk materials-Part1: General principles
- Journel, A G and Huijbregts, 1978, Mining Geostatistics, Academic Press
- Kitanidis, P.K.: Introduction to Geostatistics: Applications in Hydrogeology, Cambridge University Press. 1997.
- Lantuéjoul, C. 2002. Geostatistical simulation: models and algorithms. Springer, 256 pp.
- Lipschutz, S, 1968, Theory and Problems of Probability, McCraw-Hill Book Company, New York.
- Matheron, G. 1962. Traité de géostatistique appliquée. Tome 1, Editions Technip, Paris, 334 pp.
- Matheron, G. 1989. Estimating and choosing, Springer-Verlag, Berlin.
- McGrew, J. Chapman, & Monroe, Charles B., 2000. An introduction to statistical problem solving in geography, second edition, McGraw-Hill, New York.
- Merks, J W, 1992, Geostatistics or voodoo science, The Northern Miner, May 18
- Merks, J W, Abuse of statistics, CIM Bulletin, January 1993, Vol 86, No 966
- Myers, Donald E.; "What Is Geostatics?
- Philip, G M and Watson, D F, 1986, Matheronian Geostatistics; Quo Vadis?, Mathematical Geology, Vol 18, No 1
- Sharov, A: Quantitative Population Ecology, 1996, http://www.ento.vt.edu/~sharov/PopEcol/popecol.html
- Shine, J.A., Wakefield, G.I.: A comparison of supervised imagery classification using analyst-chosen and geostatistically-chosen training sets, 1999, http://www.geovista.psu.edu/sites/geocomp99/Gc99/044/gc_044.htm
- Volk, W, 1980, Applied Statistics for Engineers, Krieger Publishing Company, Huntington, New York.
- Wackernagel, H. 2003. Multivariate geostatistics, Third edition, Springer-Verlag, Berlin, 387 pp.
- Youden, W J, 1951, Statistical Methods for Chemists: John Wiley & Sons, New York.
See also
- statistics
- geology
- geodemographic segmentation
- geographic information system (GIS)
- remote sensing
- kriging
- pedometrics