
Search results
The page "Area diagram" does not exist. You can create a draft and submit it for review or request that a redirect be created, but consider checking the search results below to see whether the topic is already covered.
 diagram is a widely used diagram style that shows the logical relation between sets, popularized by John Venn (1834–1923) in the 1880s. The diagrams are...30 KB (3,195 words) - 13:42, 30 July 2024
 Pie chart (redirect from Polar area diagram)comparisons on one diagram, as is seen in the polar area diagram famously developed by Florence Nightingale. The first known use of polar area diagrams was by André-Michel...21 KB (2,312 words) - 16:41, 7 June 2024
 another set diagramming technique, Venn diagrams. Unlike Venn diagrams, which show all possible relations between different sets, the Euler diagram shows only...37 KB (3,613 words) - 17:56, 12 July 2024
 In software engineering, a sequence diagram shows process interactions arranged in time sequence. This diagram depicts the processes and objects involved...7 KB (909 words) - 04:54, 11 June 2024
 usage of the polar area diagram, also called the Nightingale rose diagram, which is equivalent to a modern circular histogram. This diagram is still regularly...125 KB (13,098 words) - 10:08, 8 August 2024
 In mathematics, a Voronoi diagram is a partition of a plane into regions close to each of a given set of objects. It can be classified also as a tessellation...46 KB (5,590 words) - 18:51, 13 June 2024
 spacetime diagram is a graphical illustration of locations in space at various times, especially in the special theory of relativity. Spacetime diagrams can...47 KB (6,004 words) - 20:47, 6 June 2024
 In theoretical physics, a Feynman diagram is a pictorial representation of the mathematical expressions describing the behavior and interaction of subatomic...93 KB (16,020 words) - 21:50, 8 July 2024
- A Polar diagram could refer to: Polar area diagram, a type of pie chart Radiation pattern, in antenna theory Spherical coordinate system, the three-dimensional...614 bytes (102 words) - 14:47, 15 May 2020
 A phase diagram in physical chemistry, engineering, mineralogy, and materials science is a type of chart used to show conditions (pressure, temperature...22 KB (2,517 words) - 09:13, 15 June 2024
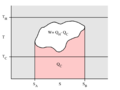 In thermodynamics, a temperature–entropy (T–s) diagram is a thermodynamic diagram used to visualize changes to temperature (T ) and specific entropy (s)...3 KB (163 words) - 02:10, 8 January 2023
 André-Michel Guerry (section Polar area diagram)population density). In 1829, Guerry invented a new graphic form, the polar area diagram to show variations in weather and other phenomena over calendar cycles...8 KB (948 words) - 02:53, 31 July 2022
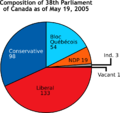 Chart (category Diagrams)chart Flow chart Area chart Cartogram Pedigree chart Radial tree Examples of less common charts are: Bubble chart Polar area diagram Waterfall chart Radar...13 KB (1,513 words) - 14:09, 21 July 2024
 Radar chart (redirect from Spider web diagram)chart, star plot, cobweb chart, irregular polygon, polar chart, or Kiviat diagram. It is equivalent to a parallel coordinates plot, with the axes arranged...20 KB (2,497 words) - 06:58, 17 June 2024
 Entity–relationship model (redirect from ER diagram)"primary keys". Diagrams created to represent attributes as well as entities and relationships may be called entity-attribute-relationship diagrams, rather than...33 KB (4,182 words) - 17:09, 3 May 2024
 / / and ⟨ ⟩, see IPA § Brackets and transcription delimiters. A vowel diagram or vowel chart is a schematic arrangement of the vowels. Depending on the...7 KB (898 words) - 21:10, 23 October 2023
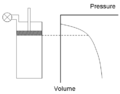 An indicator diagram is a chart used to measure the thermal, or cylinder, performance of reciprocating steam and internal combustion engines and compressors...6 KB (839 words) - 19:20, 30 March 2024
 application of shear and moment diagrams is that the deflection of a beam can be easily determined using either the moment area method or the conjugate beam...7 KB (907 words) - 00:05, 5 July 2024
- mathematical area of geometric group theory, a Van Kampen diagram (sometimes also called a Lyndon–Van Kampen diagram ) is a planar diagram used to represent...22 KB (3,201 words) - 21:09, 17 March 2023
 during the day. The main feature of thermodynamic diagrams is the equivalence between the area in the diagram and energy. When air changes pressure and temperature...9 KB (1,235 words) - 19:26, 9 April 2024


- polar area diagram (plural polar area diagrams) A form of pie chart in which each sector has the same angle, the proportions being indicated by the radius
- Britannica, Volume 8 Diagram by James Clerk Maxwell 7721021911 Encyclopædia Britannica, Volume 8 — DiagramJames Clerk Maxwell DIAGRAM (Gr. διάγραμμα, from
- A diagram is a two-dimensional geometric symbolic representation of information according to some visualization technique. CONTENT : A - F , G - L , M
- some diagrams that show this: Now that we have established how to calculate the area of a right triangle we can establish the formula for the area of any