
File:2020 United States presidential election results map by county.svg

Size of this PNG preview of this SVG file: 555 × 352 pixels. Other resolutions: 320 × 203 pixels | 640 × 406 pixels | 1,024 × 649 pixels | 1,280 × 812 pixels | 2,560 × 1,624 pixels.
Original file (SVG file, nominally 555 × 352 pixels, file size: 1.45 MB)
| This is a file from the Wikimedia Commons. Information from its description page there is shown below. Commons is a freely licensed media file repository. You can help. |
Summary
| Description |
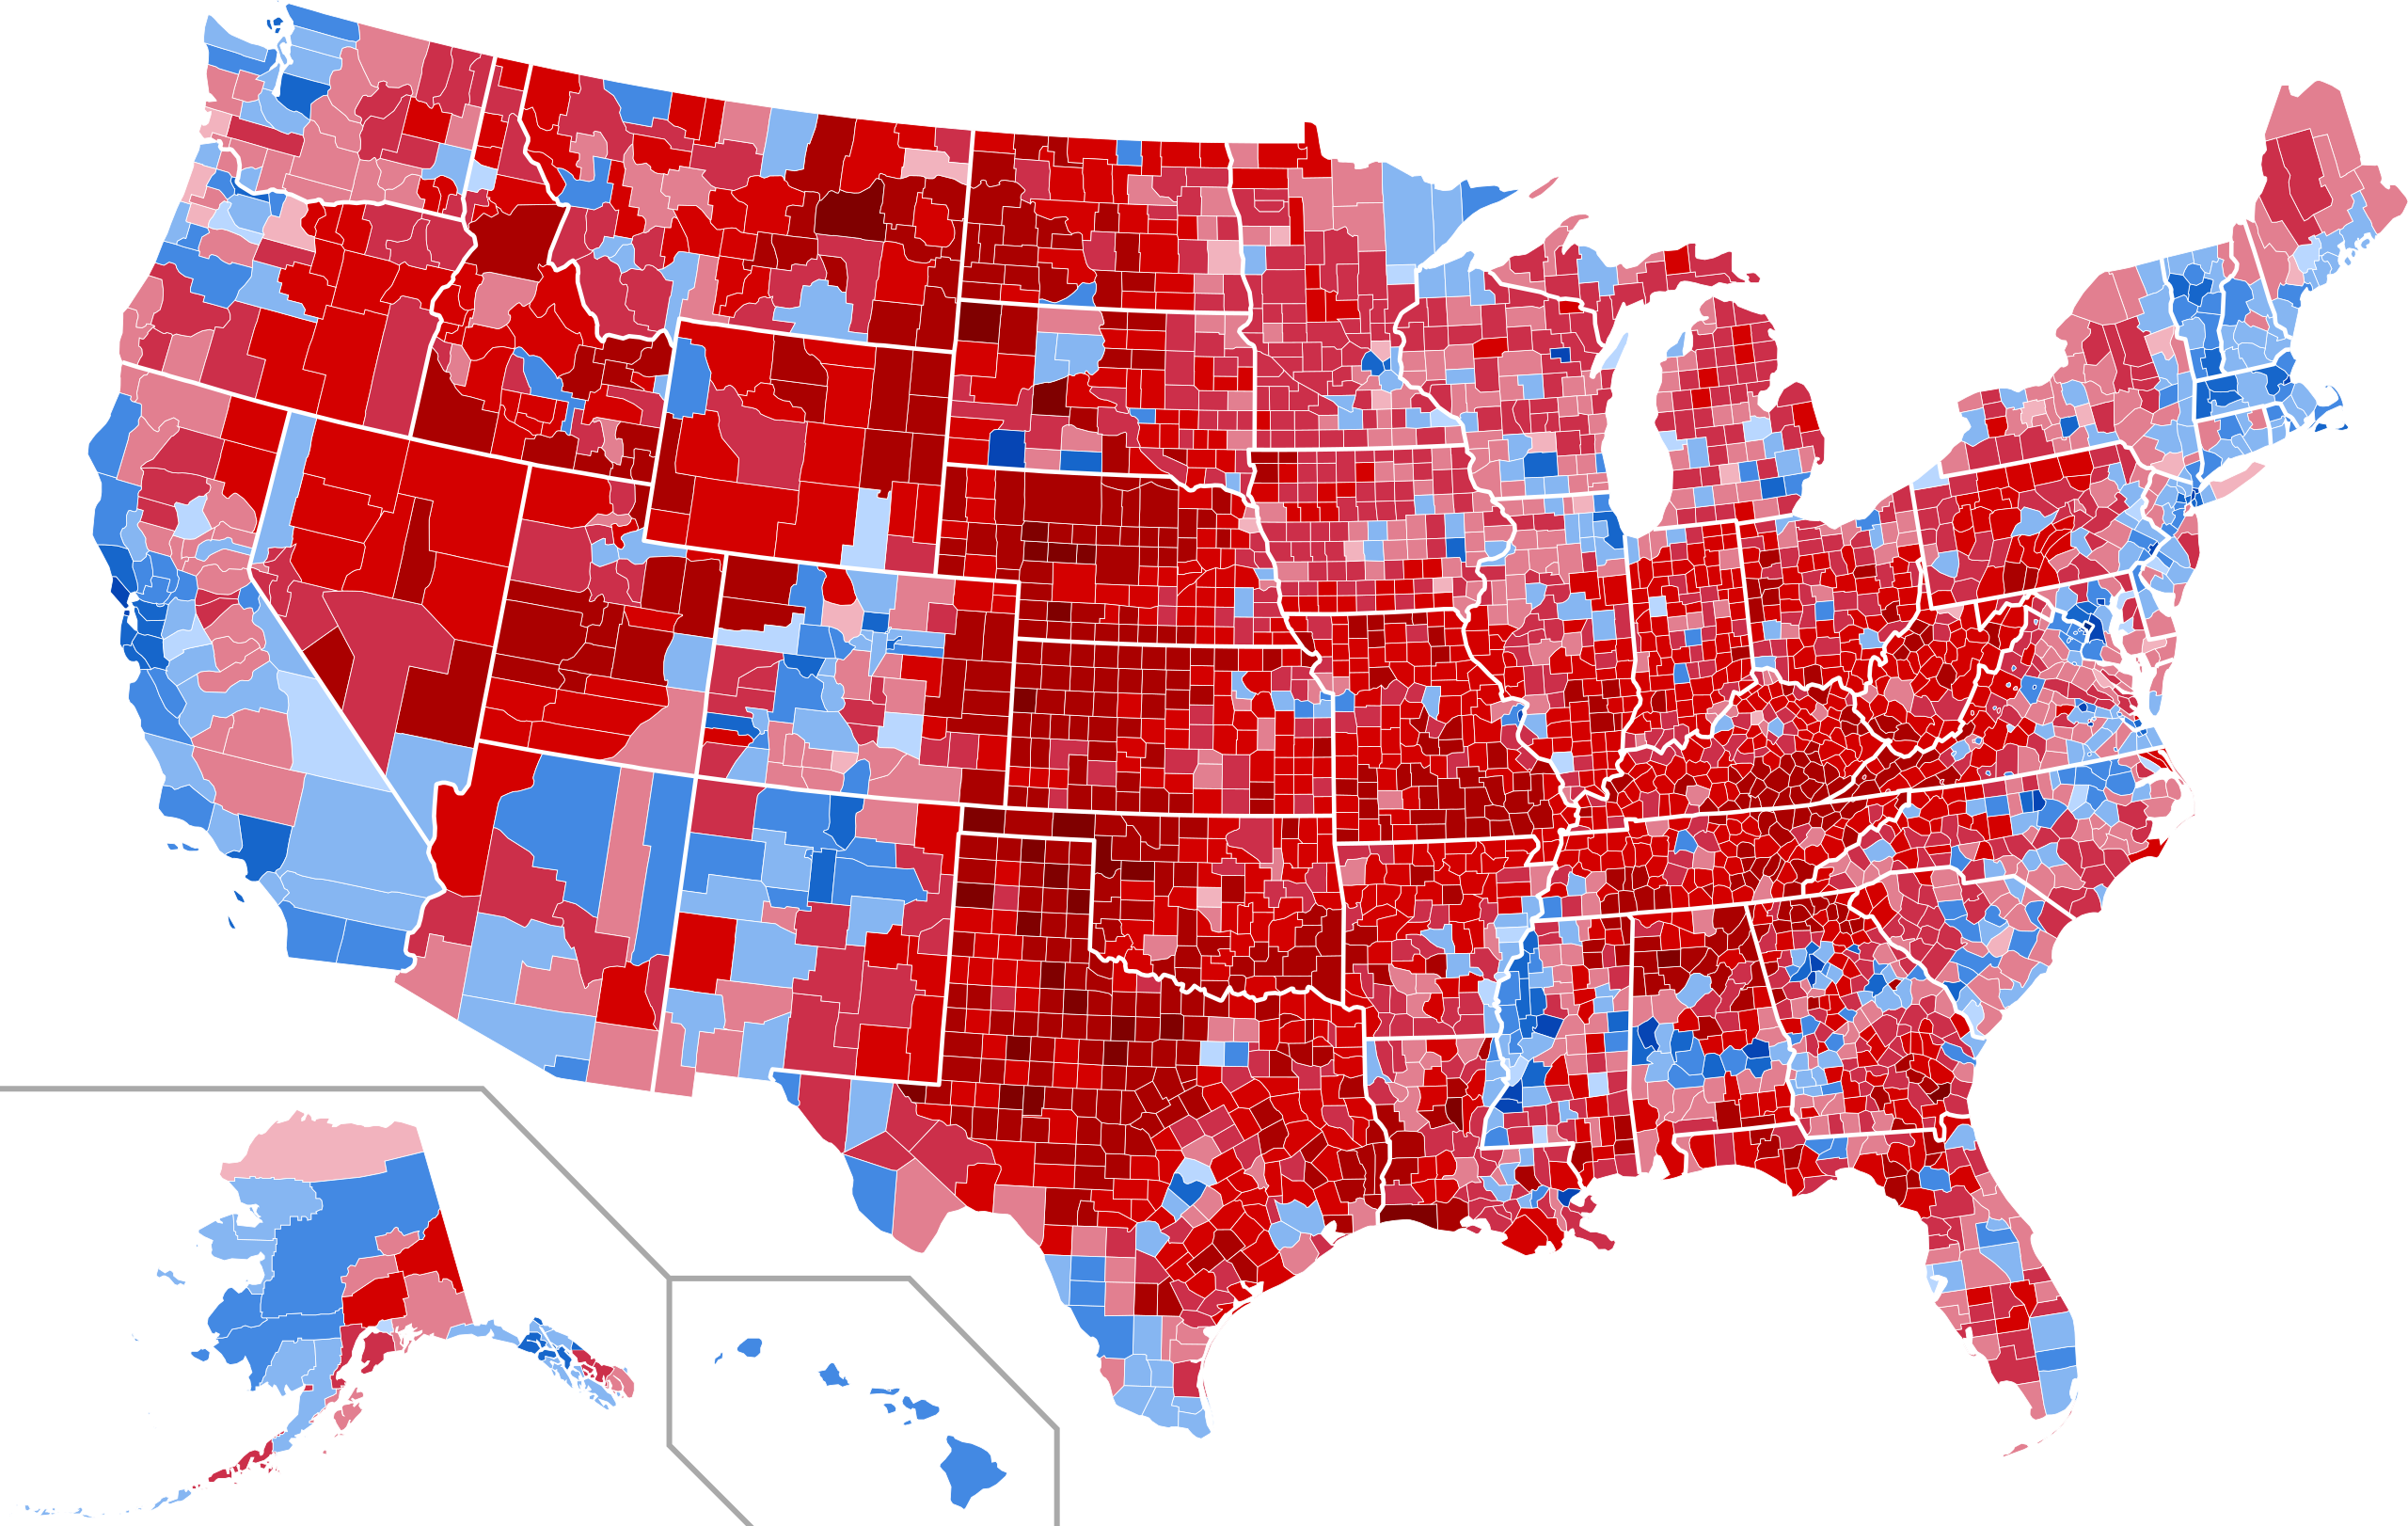
English: Results by county of the 2020 United States presidential election.
Joe Biden—>90% Joe Biden—80-90% Joe Biden—70-80% Joe Biden—60-70% Joe Biden—50-60% Joe Biden—40-50% Joe Biden—<40% Donald Trump—<40% Donald Trump—40-50% Donald Trump—50-60% Donald Trump—60-70% Donald Trump—70-80% Donald Trump—80-90% Donald Trump—>90% |
| Date | |
| Source |
This file was derived from: USA Counties with names.svg |
| Author | Magog the Ogre |
| SVG development |
Licensing
I, the copyright holder of this work, hereby publish it under the following license:
| This file is made available under the Creative Commons CC0 1.0 Universal Public Domain Dedication. | |
| The person who associated a work with this deed has dedicated the work to the public domain by waiving all of their rights to the work worldwide under copyright law, including all related and neighboring rights, to the extent allowed by law. You can copy, modify, distribute and perform the work, even for commercial purposes, all without asking permission.
|
File history
Click on a date/time to view the file as it appeared at that time.
| Date/Time | Thumbnail | Dimensions | User | Comment | |
|---|---|---|---|---|---|
| current | 15:24, 23 March 2022 | | 555 × 352 (1.45 MB) | Ngfsmg | Alaska |
| 01:26, 20 September 2021 |  | 555 × 352 (1.49 MB) | Magog the Ogre | Reverted to version as of 13:01, 26 January 2021 (UTC) "fix" used the wrong width between counties | |
| 03:02, 20 July 2021 |  | 556 × 352 (910 KB) | TylerKutschbach | Fixed Alaska map | |
| 13:01, 26 January 2021 |  | 555 × 352 (1.49 MB) | Elli | Kalawao results (Biden got >90%) | |
| 16:28, 13 January 2021 |  | 555 × 352 (1.49 MB) | Politicsfan4 | Reverted to version as of 01:16, 31 December 2020 (UTC) whoops, my bad | |
| 16:26, 13 January 2021 |  | 555 × 352 (1.49 MB) | Politicsfan4 | Reverted to version as of 20:47, 25 December 2020 (UTC) the borders were more consistent with other maps | |
| 01:16, 31 December 2020 |  | 555 × 352 (1.49 MB) | Faustino Sojo | Borders | |
| 20:47, 25 December 2020 |  | 555 × 352 (1.49 MB) | Faustino Sojo | Alaska2 | |
| 16:23, 23 December 2020 |  | 555 × 352 (1.49 MB) | Faustino Sojo | Alaska | |
| 02:09, 18 December 2020 |  | 555 × 352 (928 KB) | Magog the Ogre | weekly update 12/14 | |
| 22:46, 7 December 2020 |  | 555 × 352 (928 KB) | Magog the Ogre | weekly update 12/6 | |
| 05:23, 5 December 2020 |  | 555 × 352 (1,018 KB) | TheNavigatrr | Updated shading of several counties including Suffolk, Orange, Oneida, Ontario, Wayne in NY due to new results. | |
| 04:00, 2 December 2020 |  | 555 × 352 (1,018 KB) | TheNavigatrr | Updated Queens, Staten Island, and Tompkins County in New York due to new totals. | |
| 19:27, 1 December 2020 |  | 555 × 352 (1,018 KB) | TheNavigatrr | Updates to New York counties based on hours-old New York Times data. | |
| 01:03, 29 November 2020 |  | 555 × 352 (928 KB) | Magog the Ogre | run from weekly data dump from uselectionatlas | |
| 19:43, 27 November 2020 |  | 555 × 352 (1,018 KB) | TheNavigatrr | Minor updates to Yolo and Mendocino counties in California due to new vote counts. | |
| 03:32, 25 November 2020 |  | 555 × 352 (1,018 KB) | TheNavigatrr | Updated several counties according to new results from the New York Times, e.g. Chemung and Saratoga counties in New York. | |
| 17:45, 24 November 2020 |  | 555 × 352 (1,018 KB) | TheNavigatrr | Updated some counties, mostly in New York: Rockland and Essex to blue. Results from mail-in ballots are counted far later than other states. | |
| 14:06, 22 November 2020 |  | 555 × 352 (928 KB) | Magog the Ogre | update to upstream data set 0.5 | |
| 20:54, 19 November 2020 |  | 555 × 352 (1,017 KB) | TheNavigatrr | Updated Allegany county in New York according to NYT data. | |
| 20:47, 19 November 2020 |  | 555 × 352 (1,017 KB) | TheNavigatrr | Updated counts in counties according to New York Times data, including in Illinois' Winnebago county, Mississippi's Leflore and Holmes counties, and New York's Broome and Oswego counties. | |
| 05:15, 19 November 2020 |  | 555 × 352 (1,017 KB) | TheNavigatrr | Updated counties based on New York Times data. Rensselaer in NY, Mississippi, Iowa, California, etc. | |
| 02:31, 17 November 2020 |  | 555 × 352 (1,017 KB) | TheNavigatrr | Updated more counties based on New York Times data. | |
| 21:58, 16 November 2020 |  | 555 × 352 (1,017 KB) | TheNavigatrr | Updated many states based on Dave Leip's Election Atlas results (Mississippi) and New York Times data (Maine, Massachusetts, New York, California, etc.) Mississippi for example already certified its election results on November 13. | |
| 06:17, 14 November 2020 |  | 555 × 352 (926 KB) | Magog the Ogre | update from upstream | |
| 21:45, 13 November 2020 |  | 555 × 352 (1.03 MB) | TheNavigatrr | Added correct color for DC (above 90% Democrat, can be seen on Dave Leip's Election Atlas), corrected colors for Dutchess and Nassau counties in New York. Nassau shifted to blue today since 16,684 of 154,000 absentee ballots were counted. Sources include New York Times election map and https://bronx.news12.com/absentee-ballot-counting-begins-in-nassau-suffolk-to-start-next-week | |
| 04:38, 10 November 2020 |  | 555 × 352 (963 KB) | Magog the Ogre | daily update | |
| 04:49, 9 November 2020 |  | 555 × 352 (924 KB) | EmmaCoop | Bolder state borders in line with previous maps | |
| 02:53, 9 November 2020 |  | 555 × 352 (928 KB) | Magog the Ogre | {{Information |Description ={{en|1=Results by county of the {{w|United States presidential election, 2020}}.}} {{legend|#0645b4|{{label|Q6279}}—80-90%}} {{legend|#1666cb|{{label|Q6279|link=-}}—70-80%}} {{legend|#4389e3|{{label|Q6279|link=-}}—60-70%}} {{legend|#86b6f2|{{label|Q6279|link=-}}—50-60%}} {{legend|#b9d7ff|{{label|Q6279|link=-}}—40-50%}} {{legend|#d3e7ff|{{label|Q6279|link=-}}—<40%}} {{legend|#FFCCD0|{{label|Q22686}}—<40%}} {{legend|#f2b3be|{{label|Q22686|link=-}}—40-50%}} {{legen... |
File usage
The following pages on the English Wikipedia use this file (pages on other projects are not listed):
Global file usage
The following other wikis use this file:
- Usage on de.wikipedia.org
- Usage on en.wikivoyage.org
- Usage on es.wikipedia.org
- Usage on fa.wikipedia.org
- Usage on frr.wikipedia.org
- Usage on fr.wikipedia.org
- Usage on fy.wikipedia.org
- Usage on he.wikipedia.org
- Usage on it.wikipedia.org
- Usage on ko.wikipedia.org
- Usage on no.wikipedia.org
- Usage on pt.wikipedia.org