1959 Sale Municipal Borough Council election
Appearance
| |||||||||||||||||||||||||||||||||||||||||||||
8 of 32 seats to Sale Municipal Borough Council 16 seats needed for a majority | |||||||||||||||||||||||||||||||||||||||||||||
|---|---|---|---|---|---|---|---|---|---|---|---|---|---|---|---|---|---|---|---|---|---|---|---|---|---|---|---|---|---|---|---|---|---|---|---|---|---|---|---|---|---|---|---|---|---|
| |||||||||||||||||||||||||||||||||||||||||||||
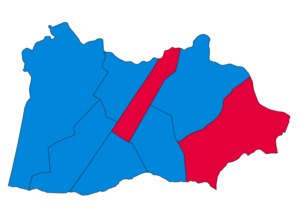
 Map of results of 1959 election | |||||||||||||||||||||||||||||||||||||||||||||
| |||||||||||||||||||||||||||||||||||||||||||||
Elections to Sale Council were held on Thursday, 7 May 1959. One third of the councillors were up for election, with each successful candidate to serve a three-year term of office. The Conservative Party retained overall control of the council.[1][2]
Election result
[edit]| Party | Votes | Seats | Full Council | |||||||
| Conservative Party | 8,560 (56.9%) | 6 (75.0%) | 6 / 8
|
22 (68.8%) | 22 / 32
| |||||
| Labour Party | 3,469 (23.1%) | 2 (25.0%) | 2 / 8
|
7 (21.9%) | 7 / 32
| |||||
| Liberal Party | 3,013 (20.0%) | 0 (0.0%) | 0 / 8
|
3 (9.4%) | 3 / 32
| |||||
Full council
[edit]| 7 | 3 | 22 |
Aldermen
[edit]| 8 |
Councillors
[edit]| 7 | 3 | 14 |
Ward results
[edit]Brooklands
[edit]| Party | Candidate | Votes | % | ±% | |
|---|---|---|---|---|---|
| Conservative | P. A. A. Pepper* | 1,156 | 58.1 | −25.1 | |
| Liberal | A. Howarth | 832 | 41.9 | N/A | |
| Majority | 324 | 16.3 | −50.1 | ||
| Turnout | 1,988 | ||||
| Conservative hold | Swing | ||||
Mersey
[edit]| Party | Candidate | Votes | % | ±% | |
|---|---|---|---|---|---|
| Conservative | R. G. Graham* | 1,241 | 69.2 | −0.9 | |
| Labour | C. Jackson | 553 | 30.8 | +0.9 | |
| Majority | 688 | 38.4 | −1.4 | ||
| Turnout | 1,794 | ||||
| Conservative hold | Swing | ||||
St. Anne's
[edit]| Party | Candidate | Votes | % | ±% | |
|---|---|---|---|---|---|
| Conservative | F. S. Laughton | 1,188 | 44.2 | +10.8 | |
| Liberal | J. S. Rowlinson* | 1,091 | 40.6 | −10.8 | |
| Labour | A. Quinn | 407 | 15.2 | 0 | |
| Majority | 97 | 3.6 | |||
| Turnout | 2,686 | ||||
| Conservative gain from Liberal | Swing | ||||
St. John's
[edit]| Party | Candidate | Votes | % | ±% | |
|---|---|---|---|---|---|
| Conservative | S. P. Harris* | 1,189 | 52.2 | +6.7 | |
| Liberal | A. Chapman | 1,090 | 47.8 | +4.4 | |
| Majority | 99 | 4.4 | +2.3 | ||
| Turnout | 2,279 | ||||
| Conservative hold | Swing | ||||
St. Martin's
[edit]| Party | Candidate | Votes | % | ±% | |
|---|---|---|---|---|---|
| Conservative | H. Jackson | 1,812 | 58.4 | +8.5 | |
| Labour | E. P. Mellor | 1,289 | 41.6 | −8.5 | |
| Majority | 523 | 16.8 | |||
| Turnout | 3,101 | ||||
| Conservative hold | Swing | ||||
St. Mary's
[edit]| Party | Candidate | Votes | % | ±% | |
|---|---|---|---|---|---|
| Conservative | M. Dickinson* | 1,303 | 86.2 | +21.1 | |
| Labour | L. I. Atkinson | 208 | 13.8 | +8.4 | |
| Majority | 1,095 | 72.4 | +36.8 | ||
| Turnout | 1,511 | ||||
| Conservative hold | Swing | ||||
St. Paul's
[edit]| Party | Candidate | Votes | % | ±% | |
|---|---|---|---|---|---|
| Labour | T. A. Winnington* | 1,012 | 60.1 | +1.0 | |
| Conservative | J. G. McBeath | 671 | 39.9 | −1.0 | |
| Majority | 341 | 20.2 | +2.0 | ||
| Turnout | 1,683 | ||||
| Labour hold | Swing | ||||
Sale Moor
[edit]| Party | Candidate | Votes | % | ±% | |
|---|---|---|---|---|---|
| Labour | W. M. Phillips* | uncontested | |||
| Labour hold | Swing | ||||
