From Wikipedia, the free encyclopedia
Part of the 1991 Irish local elections
1991 Laois County Council election|
|
|
|
|
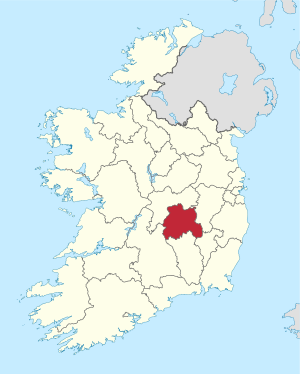 Map showing the area of Laois County Council |
Council control before election
Fianna Fáil
|
Council control after election
Fianna Fáil
| |
An election to Laois County Council took place on 27 June 1991 as part of that year's Irish local elections. 25 councillors were elected from five local electoral areas (LEAs) for a five-year term of office on the electoral system of proportional representation by means of the single transferable vote (PR-STV). This term was extended twice, first to 1998, then to 1999.[1][2]
Results by party[edit]
Results by local electoral area[edit]
Borris-in-Ossory[edit]
Borris-in-Ossory - 7 seats
| Party |
Candidate |
FPv% |
Count
|
| 1 |
2 |
3 |
4 |
5 |
6 |
7 |
8 |
9
|
|
|
Fianna Fáil
|
Liam Hyland TD*
|
18%
|
1,219
|
|
|
|
|
|
|
|
|
|
|
Independent
|
Jimmy Kelly*
|
12.2%
|
828
|
856
|
|
|
|
|
|
|
|
|
|
Fianna Fáil
|
Kieran Phelan
|
11.1%
|
751
|
816
|
818
|
861
|
|
|
|
|
|
|
|
Fine Gael
|
William Mansfield*
|
10.7%
|
728
|
749
|
751
|
819
|
826
|
898
|
|
|
|
|
|
Labour
|
Larry Kavanagh
|
8.8%
|
594
|
617
|
618
|
630
|
631
|
729
|
735
|
844
|
917
|
|
|
Fianna Fáil
|
Eamon Rafter*
|
8%
|
539
|
590
|
591
|
629
|
633
|
638
|
638
|
726
|
754
|
|
|
Fine Gael
|
Marty Phelan
|
7%
|
476
|
513
|
513
|
576
|
576
|
601
|
612
|
644
|
902
|
|
|
Fine Gael
|
Stephen Murphy
|
6.11
|
411
|
425
|
425
|
433
|
433
|
455
|
487
|
496
|
|
|
|
Fianna Fáil
|
Thomas Fennelly
|
5.8%
|
392
|
446
|
447
|
447
|
451
|
457
|
457
|
555
|
624
|
|
|
Fianna Fáil
|
Fintan Phelan*
|
4.4%
|
299
|
365
|
366
|
376
|
377
|
412
|
413
|
|
|
|
|
Fine Gael
|
Patrick McMahon*
|
4%
|
272
|
276
|
276
|
278
|
278
|
|
|
|
|
|
|
Independent
|
Peter Loughman
|
3.9%
|
267
|
275
|
275
|
|
|
|
|
|
|
| Electorate: 12,812 Valid: 7,814 (60.99%) Spoilt: 116 Quota: 977 Turnout: 7,930 (61.90%)
|
Luggacurren[edit]
Luggacurren- 4 seats
| Party |
Candidate |
FPv% |
Count
|
| 1 |
2 |
3 |
4 |
5 |
6
|
|
|
Fianna Fáil
|
James Cooney*
|
15.9%
|
600
|
629
|
758
|
|
|
|
|
|
Fine Gael
|
John Moran
|
15.5%
|
585
|
661
|
693
|
843
|
|
|
|
|
Fianna Fáil
|
Martin Rohan*
|
15.3%
|
575
|
581
|
626
|
663
|
667
|
679
|
|
|
Fianna Fáil
|
Mary Wheatley*
|
13%
|
491
|
538
|
631
|
674
|
678
|
690
|
|
|
Fine Gael
|
James Daly
|
12.7%
|
478
|
552
|
575
|
742
|
822
|
|
|
|
Fianna Fáil
|
Mary Redmond
|
9.8%
|
368
|
382
|
|
|
|
|
|
|
Fine Gael
|
Senator Charles McDonald*
|
9.5%
|
358
|
394
|
431
|
|
|
|
|
|
Labour
|
Tony O'Brien
|
7.9%
|
299
|
|
|
|
|
|
|
|
Independent
|
Thomas McCormack
|
0.4%
|
16
|
|
|
|
|
|
| Electorate: 5,972 Valid: 3,770 (63.13%) Spoilt: 35 Quota: 755 Turnout: 3,805 (63.71%)
|
Portlaoise[edit]
Portlaoise - 5 seats
| Party |
Candidate |
FPv% |
Count
|
| 1 |
2 |
3 |
4 |
5 |
6 |
7 |
8 |
9 |
10
|
|
|
Fianna Fáil
|
Joe Dunne*
|
30.5%
|
1,316
|
|
|
|
|
|
|
|
|
|
|
|
Fine Gael
|
William Aird*
|
14.5%
|
625
|
684
|
685
|
698
|
741
|
|
|
|
|
|
|
|
Fine Gael
|
Tom Keenan*
|
14.5%
|
624
|
686
|
688
|
711
|
747
|
|
|
|
|
|
|
|
Fianna Fáil
|
Tom Jacob
|
7.3%
|
314
|
489
|
489
|
500
|
517
|
519
|
521
|
534
|
559
|
703
|
|
|
Fianna Fáil
|
Jerry Lodge*
|
7.1%
|
304
|
436
|
436
|
450
|
466
|
472
|
476
|
518
|
549
|
678
|
|
|
Progressive Democrats
|
Assumpta Broomfield
|
6.8%
|
292
|
314
|
314
|
325
|
338
|
343
|
346
|
397
|
464
|
493
|
|
|
Fianna Fáil
|
John Fitzgibbon
|
5.9%
|
254
|
331
|
331
|
338
|
341
|
341
|
342
|
350
|
373
|
|
|
|
Fine Gael
|
Ger O'Donoghue
|
4.3%
|
187
|
198
|
198
|
205
|
221
|
233
|
246
|
267
|
|
|
|
|
Labour
|
Tom Phelan
|
3.2%
|
139
|
151
|
151
|
178
|
184
|
186
|
188
|
|
|
|
|
|
Fine Gael
|
Anthony Dunne
|
3%
|
129
|
150
|
152
|
165
|
|
|
|
|
|
|
|
|
Independent
|
Joe McCormack
|
2.8%
|
120
|
145
|
149
|
|
|
|
|
|
|
|
|
|
Independent
|
Joseph Bannan
|
0.2%
|
8
|
9
|
|
|
|
|
|
|
|
|
| Electorate: 7,588 Valid: 4,312 (56.83%) Spoilt: 24 Quota: 719 Turnout: 4,336 (57.14%)
|
Tinnahinch[edit]
References[edit]
External links[edit]


