Jump to content

1980 Harlow District Council election

From Wikipedia, the free encyclopedia

This is an old revision of this page, as edited by Materialscientist (talk | contribs) at 09:23, 11 March 2023 (Reverted edits by 2A00:23C5:E29D:3D01:E463:1F88:C3D4:AADB (talk) to last version by Monkbot). The present address (URL) is a permanent link to this revision, which may differ significantly from the current revision.

1980 Harlow District Council election[1][2]
← 1979 1 May 1980 1982 →

15 of the 42 seats to Harlow District Council
23 seats needed for a majority
  First party Second party Third party
 
Party Labour Conservative Liberal
Last election 32 7 2
Seats won 14 1 0
Seats after 33 7 2
Seat change Increase1 Steady Decrease1
Popular vote 12,365 4,891 2,537
Percentage 62.3% 24.7% 12.8%

Map showing the results of contested wards in the 1980 Harlow District Council elections.

Council control before election

Labour

Council control after election

Labour

The 1980 Harlow District Council election took place on 1 May 1980 to elect members of Harlow District Council in Essex, England. This was on the same day as other local elections. The Labour Party retained control of the council.

Election result

1980 Harlow local election result[2]
Party Seats Gains Losses Net gain/loss Seats % Votes % Votes +/−
  Labour 14 1 0 Increase1 93.3 62.3 12,365
  Conservative 1 0 0 Steady 6.7 24.7 4,891
  Liberal 0 0 1 Decrease1 0.0 12.8 2,537
  National Front 0 0 0 Steady 0.0 0.2 48

Ward results

Brays Grove

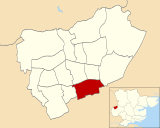
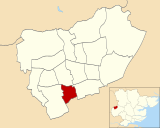
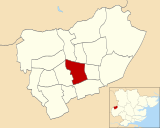
Location of Brays Grove ward
Brays Grove[3]
Party Candidate Votes %
Labour D. Burnham 775 75.0%
Conservative M. Ashcroft 258 25.0%
Turnout 31.0%
Labour hold

Great Parndon

Location of Great Parndon ward
Great Parndon[3]
Party Candidate Votes %
Labour J. Cave 837 61.4%
Conservative R. Weyers 412 30.2%
Liberal T. Owen 114 8.4%
Turnout 41.0%
Labour hold

Hare Street and Town Centre

Location of Hare Street and Town Centre ward
Hare Street and Town Centre[3]
Party Candidate Votes %
Labour J. Hobbs 689 64.6%
Conservative E. Atkins 243 22.8%
Liberal A. Merryweather 135 12.7%
Turnout 35.1%
Labour hold

Kingsmoor

Location of Kingsmoor ward
Kingsmoor[3]
Party Candidate Votes %
Labour T. Kent 863 53.9%
Conservative L. Atkins 617 38.5%
Liberal L. Swanton 122 7.6%
Turnout 35.2%
Labour hold

Latton Bush

Location of Latton Bush ward
Latton Bush[3]
Party Candidate Votes %
Labour K. Edwards 1,172 68.8%
Conservative R. Brown 428 25.1%
Liberal C. Merryweather 104 6.1%
Turnout 40.2%
Labour hold

Little Parndon

Location of Little Parndon ward
Little Parndon[3]
Party Candidate Votes %
Labour D. Condon 1,008 60.2%
Conservative M. Tombs 338 20.2%
Liberal P. Ramsay 329 19.6%
Turnout 38.5%
Labour hold

Mark Hall South

Location of Mark Hall South ward
Mark Hall South[3]
Party Candidate Votes %
Labour T. Farr 967 69.0%
Liberal J. Mercer 435 31.0%
Turnout 59.6%
Labour hold

Netteswell East

Location of Netteswell East ward
Netteswell East[3]
Party Candidate Votes %
Labour A. Graham 741 68.0%
Conservative P. Harries 268 24.6%
Liberal D. Eldridge 81 7.4%
Turnout 35.8%
Labour hold

Netteswell West

Location of Netteswell West ward
Netteswell[3]
Party Candidate Votes %
Labour J. Desormeaux 628 68.2%
Conservative F. Burgoyne 175 19.0%
Liberal W. Mitchell 118 12.8%
Turnout 37.3%
Labour hold

Old Harlow

Location of Old Harlow ward
Old Harlow[3]
Party Candidate Votes %
Conservative H. Dutton 1,166 50.3%
Labour S. Firth 1,151 49.7%
Turnout 51.0%
Conservative hold

Passmores

Location of Passmores ward
Passmores[3]
Party Candidate Votes %
Labour A. Jones 846 60.2%
Conservative C. Brown 340 24.2%
Liberal D. Filler 219 15.6%
Turnout %
Labour hold

Potter Street

Location of Potter Street ward
Passmores[3]
Party Candidate Votes %
Labour V. Phelps 907 73.2%
Conservative L. Crust 200 16.1%
Liberal S. Ward 132 10.7%
Turnout 38.7%
Labour hold

Stewards

Location of Stewards ward
Stewards[3]
Party Candidate Votes %
Labour H. Talbot 794 48.9%
Liberal J. Hewitt 608 37.4%
Conservative R. Cross 223 13.7%
Turnout 41.3%
Labour gain from Liberal

Tye Green (2 seats)

Location of Tye Green ward
Tye Green (2 seats)[3]
Party Candidate Votes %
Labour A. James 987
Labour J. Ellis 964
Conservative E. Gibson 223
Conservative S. Tombs 195
Liberal L. Fuller 140
Liberal M. Ramsey 128
National Front C. Saunders 48
Turnout 35.9%
Labour hold
Labour hold

References

  1. ^ "Council compositions by year". The Elections Centre.
  2. ^ a b "Local Election Summaries 1980". The Elections Centre.
  3. ^ a b c d e f g h i j k l m n "Harlow District Council Election Results 1973-2012" (PDF). Elections Centre. Retrieved 27 September 2019.