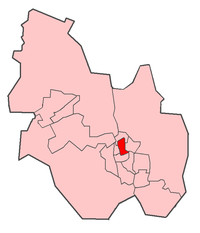
All Saints (Kettering BC Ward)
Appearance
| All Saints Ward (Kettering Borough Council) | |
|---|---|
 All Saints within Kettering Borough | |
 Kettering Borough within Northamptonshire |
 Northamptonshire within England |
All Saints Ward is a three-member ward within Kettering Borough Council and is commonly regarded as a marginal ward between Conservatives and Labour. The ward was last fought at borough council level in the 2015 local council elections. Three Conservative councillors were elected: Cllr Lesley Thurland, Cllr James Burton and Cllr Greg Titcombe.
Councillors
Kettering Borough Council Elections 2011
- Michael Brown (Conservative)
- Michelle George (Labour)
- Jonathan West (Labour)
| Party | Candidate | Votes | % | ±% | |
|---|---|---|---|---|---|
| Conservative | Michael Brown (E) | 1019 | |||
| Labour | Michelle George (E) | 1005 | |||
| Labour | Jonathan West (E) | 1000 | |||
| Conservative | Greg Titcombe | 954 | |||
| Labour | Steve King | 898 | |||
| Conservative | Chris Smith-Haynes | 876 | |||
| Turnout | 38.1 | ||||
Councillors
Kettering Borough Council Elections 2007
- Chris Smith-Haynes (Conservative)
- Greg Titcombe (Conservative)
- Jonathan West (Labour)
Kettering Borough Council Elections 2003
- Greg Titcombe (Conservative)
- Chris Smith-Haynes (Conservative)
Kettering Borough Council Elections 1999
Current Ward Boundaries (2007-)
- Note: due to boundary changes, vote changes listed below are based on notional results.
| Party | Candidate | Votes | % | ±% | |
|---|---|---|---|---|---|
| Conservative | Chris Smith-Haynes (E) | 905 | |||
| Conservative | Greg Titcombe (E) | 883 | |||
| Labour | Jonathan West (E) | 859 | |||
| Labour | Susan Holmes | 838 | |||
| Conservative | Stephen Castens | 726 | |||
| Labour | Steve King | 705 | |||
| Green | Alan Heath | 426 | |||
| Turnout | 2,012 | 35.0 | |||
Historic Ward Boundaries (1999-2007)
| Party | Candidate | Votes | % | ±% | |
|---|---|---|---|---|---|
| Conservative | Greg Titcombe | 566 | 28.6 | ||
| Conservative | Chris Smith-Haynes | 563 | 28.5 | ||
| Labour | Sue Holmes | 451 | 22.8 | ||
| Labour | David Threadgold | 398 | 20.1 | ||
| Ward Summary | |||||
|---|---|---|---|---|---|
| Party | Votes | % Votes | Seats | Change | |
| Conservative | 565 | 57.1 | 2 | +2 | |
| Labour | 425 | 42.3 | 0 | -2 | |
| Total Votes Cast | 989 | ||||
| Electorate | 2,842 | ||||
| Turnout | 34.8% | ||||
(Vote count shown is ward average)
