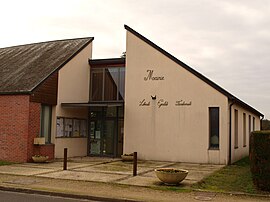
Nesploy
Appearance
Nesploy | |
|---|---|
 The town hall in Nesploy | |
| Coordinates: 47°59′50″N 2°21′45″E / 47.9972°N 2.3625°E | |
| Country | France |
| Region | Centre-Val de Loire |
| Department | Loiret |
| Arrondissement | Montargis |
| Canton | Lorris |
| Intercommunality | Canaux et Forêts en Gâtinais |
| Government | |
| • Mayor (2020–2026) | Marie-Christine Fontaine[1] |
Area 1 | 12.87 km2 (4.97 sq mi) |
| Population (2021)[2] | 364 |
| • Density | 28/km2 (73/sq mi) |
| Demonym | Nesployois |
| Time zone | UTC+01:00 (CET) |
| • Summer (DST) | UTC+02:00 (CEST) |
| INSEE/Postal code | 45223 /45270 |
| Elevation | 112–144 m (367–472 ft) |
| Website | http://www.nesploy.fr/ |
| 1 French Land Register data, which excludes lakes, ponds, glaciers > 1 km2 (0.386 sq mi or 247 acres) and river estuaries. | |
Nesploy (French pronunciation: [nɛplwa]) is a commune in the Loiret department in north-central France.
Geography
The river Bézonde goes through the commune limits. The commune itself is located in the Orléanais agricultural region. Nearby municipalities are Combreux, Montbarrois, Saint-Loup-des-Vignes, and Fréville-du-Gâtinais.[3]
History
The area of this town has historically been located in the royal forest of the Duke of Orléans. Only one of four castles remain from the past.
Demographics
As of 2018, the commune had a population of 363.
|
| ||||||||||||||||||||||||||||||||||||||||||||||||||||||||||||||||||||||||||||||||||||||||||||||||||||||||||||||||||
| |||||||||||||||||||||||||||||||||||||||||||||||||||||||||||||||||||||||||||||||||||||||||||||||||||||||||||||||||||
| Source: EHESS[4] and INSEE (1968-2017)[5] | |||||||||||||||||||||||||||||||||||||||||||||||||||||||||||||||||||||||||||||||||||||||||||||||||||||||||||||||||||
See also
References
- ^ "Répertoire national des élus: les maires". data.gouv.fr, Plateforme ouverte des données publiques françaises (in French). 2 December 2020.
- ^ "Populations légales 2021" (in French). The National Institute of Statistics and Economic Studies. 28 December 2023.
- ^ "Quelques villes proches de Nesploy". villorama.com (in French). Retrieved 22 March 2022.
- ^ Des villages de Cassini aux communes d'aujourd'hui: Commune data sheet Nesploy, EHESS (in French).
- ^ Population en historique depuis 1968, INSEE
Wikimedia Commons has media related to Nesploy.


