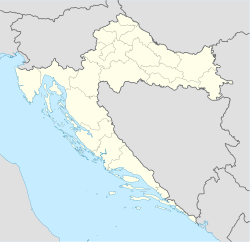
Slatina, Croatia
This article needs additional citations for verification. (January 2016) |
Slatina | |
|---|---|
| Grad Slatina Town of Slatina | |
 Main square "Trg svetog Josipa" | |
| Coordinates: 45°42′08″N 17°42′04″E / 45.70222°N 17.70111°E | |
| Country | |
| County | |
| Government | |
| • Mayor | Denis Ostrošić (DP) |
| Area | |
• Town | 167.8 km2 (64.8 sq mi) |
| • Urban | 47.3 km2 (18.3 sq mi) |
| Population (2021)[2] | |
• Town | 11,503 |
| • Density | 69/km2 (180/sq mi) |
| • Urban | 8,722 |
| • Urban density | 180/km2 (480/sq mi) |
| Time zone | UTC+1 (Central European Time) |
| Website | slatina |
Slatina is a town in the Slavonia region of Croatia. It is located in the Virovitica-Podravina County, at the contact of the Drava valley and the foothills of Papuk mountain, in the central part of the region of Podravina, 29 km (18 mi) southeast of Virovitica; elevation 127 metres (417 feet). It was ruled by Ottoman Empire between 1542 and 1687, when it was captured by Austrian troops. During Ottoman rule it was initially part of Sanjak of Pojega between 1542 and 1601, latterly part of Sanjak of Rahoviçe between 1601 and 1687. It was district centre at Virovitica County in Kingdom of Croatia-Slavonia between 1868 and 1918.
"Slatina" means "salt lake" in Croatian. However, there is no salt lake there any more.[3][dubious – discuss]
Demographics
The population of the town is 10,152 (2011), with a total of 13,609 in the municipality, composed of the following settlements:[4]
- Bakić, population 537
- Bistrica, population 165
- Donji Meljani, population 259
- Golenić, population 22
- Gornji Miholjac, population 304
- Ivanbrijeg, population 30
- Kozice, population 511
- Lukavac, population 99
- Markovo, population 131
- Medinci, population 200
- Novi Senkovac, population 301
- Radosavci, population 99
- Sladojevački Lug, population 90
- Sladojevci, population 730
- Slatina, population 10,208
In 2001, 85.5% of the population were Croats. In 2011, there were 88.35% Croats, 9.16% Serbs, and 2.49% others.[5]
| population | 5464 | 6625 | 6548 | 8372 | 9188 | 10201 | 10290 | 11929 | 11805 | 12509 | 12598 | 13475 | 14638 | 15844 | 14819 | 13686 | 11503 |
| 1857 | 1869 | 1880 | 1890 | 1900 | 1910 | 1921 | 1931 | 1948 | 1953 | 1961 | 1971 | 1981 | 1991 | 2001 | 2011 | 2021 |
Politics
Minority councils
Directly elected minority councils and representatives are tasked with consulting tasks for the local or regional authorities in which they are advocating for minority rights and interests, integration into public life and participation in the management of local affairs.[6] At the 2023 Croatian national minorities councils and representatives elections Serbs of Croatia fulfilled legal requirements to elect 15 members minority councils of the Town of Slatina.[7]
References
- ^ Register of spatial units of the State Geodetic Administration of the Republic of Croatia. Wikidata Q119585703.
- ^ "Population by Age and Sex, by Settlements" (xlsx). Census of Population, Households and Dwellings in 2021. Zagreb: Croatian Bureau of Statistics. 2022.
- ^ "Hrvatski jezični portal".
- ^ "Population by Age and Sex, by Settlements, 2011 Census: Slatina". Census of Population, Households and Dwellings 2011. Zagreb: Croatian Bureau of Statistics. December 2012.
- ^ "Population by Ethnicity, by Towns/Municipalities, 2011 Census: Slatina". Census of Population, Households and Dwellings 2011. Zagreb: Croatian Bureau of Statistics. December 2012.
- ^ "Manjinski izbori prve nedjelje u svibnju, kreću i edukacije". T-portal. 13 March 2023. Retrieved 10 June 2023.
- ^ "Informacija o konačnim rezultatima izbora članova vijeća i izbora predstavnika nacionalnih manjina 2023. X. VIROVITIČKO-PODRAVSKA ŽUPANIJA" (PDF) (in Croatian). Državno izborno povjerenstvo Republike Hrvatske. 2023. p. 6. Retrieved 10 June 2023.


