Jump to content

Dabergotz

Coordinates: 52°53′59″N 12°43′59″E / 52.89972°N 12.73306°E / 52.89972; 12.73306
From Wikipedia, the free encyclopedia

This is an old revision of this page, as edited by Kelutral (talk | contribs) at 09:03, 16 August 2018. The present address (URL) is a permanent link to this revision, which may differ significantly from the current revision.

Dabergotz
Church
Church
Location of Dabergotz within Ostprignitz-Ruppin district
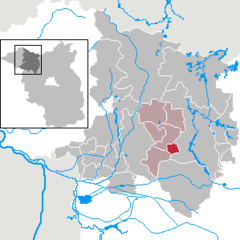
WittstockHeiligengrabeRheinsbergNeuruppinLindowVielitzseeHerzbergRüthnickFehrbellinKyritzBreddinStüdenitz-SchönermarkZernitz-LohmNeustadt (Dosse)Sieversdorf-HohenofenDreetzWalslebenDabergotzStorbeck-FrankendorfTemnitzquellTemnitztalMärkisch LindenWusterhausenSaxony-AnhaltMecklenburg-VorpommernMecklenburg-VorpommernMecklenburg-VorpommernMecklenburg-Vorpommern
Dabergotz is located in Germany
Dabergotz
Dabergotz
Dabergotz is located in Brandenburg
Dabergotz
Dabergotz
Coordinates: 52°53′59″N 12°43′59″E / 52.89972°N 12.73306°E / 52.89972; 12.73306
CountryGermany
StateBrandenburg
DistrictOstprignitz-Ruppin
Municipal assoc.Temnitz
Government
 • MayorGünther Woidt (CDU)
Area
 • Total12.59 km2 (4.86 sq mi)
Elevation
43 m (141 ft)
Population
 (2022-12-31)[1]
 • Total632
 • Density50/km2 (130/sq mi)
Time zoneUTC+01:00 (CET)
 • Summer (DST)UTC+02:00 (CEST)
Postal codes
16818
Dialling codes03391
Vehicle registrationOPR
Websitewww.amt-temnitz.de

Dabergotz is a municipality in the Ostprignitz-Ruppin district, in Brandenburg, Germany.

Demography

Development of population since 1875 within the current boundaries (Blue line: Population; Dotted line: Comparison to population development of Brandenburg state; Grey background: Time of Nazi rule; Red background: Time of communist rule)
Dabergotz: Population development
within the current boundaries (2013)[2]
YearPop.±% p.a.
1875 407—    
1890 426+0.30%
1910 416−0.12%
1925 449+0.51%
1933 429−0.57%
1939 438+0.35%
1946 852+9.97%
1950 771−2.47%
1964 623−1.51%
1971 663+0.89%
1981 574−1.43%
1985 546−1.24%
1989 534−0.55%
1990 520−2.62%
1991 524+0.77%
1992 515−1.72%
1993 529+2.72%
1994 529+0.00%
1995 523−1.13%
1996 525+0.38%
YearPop.±% p.a.
1997 541+3.05%
1998 564+4.25%
1999 581+3.01%
2000 592+1.89%
2001 588−0.68%
2002 622+5.78%
2003 608−2.25%
2004 614+0.99%
2005 605−1.47%
2006 616+1.82%
2007 614−0.32%
2008 590−3.91%
2009 596+1.02%
2010 590−1.01%
2011 613+3.90%
2012 599−2.28%
2013 601+0.33%
2014 603+0.33%
2015 599−0.66%
2016 611+2.00%

References

  1. ^ "Bevölkerungsentwicklung und Bevölkerungsstandim Land Brandenburg Dezember 2022" (PDF). Amt für Statistik Berlin-Brandenburg (in German). June 2023.
  2. ^ Detailed data sources are to be found in the Wikimedia Commons.Population Projection Brandenburg at Wikimedia Commons