
Northamptonshire County Council elections
Northamptonshire County Council in England is elected every four years.
Political control
| Party in control | Years |
|---|---|
| Labour | 1973 - 1977 |
| Conservative | 1977 - 1981 |
| No overall control | 1981 - 1993 |
| Labour | 1993 - 2005 |
| Conservative | 2005–present |
Council elections
- 2001 Northamptonshire County Council election (boundary changes increased the number of seats by 5)[1]
- 2005 Northamptonshire County Council election
- 2009 Northamptonshire County Council election
- 2013 Northamptonshire County Council election
- 2017 Northamptonshire County Council election
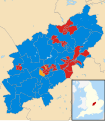
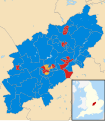
County result maps
-
 2001 results map
 -
 2005 results map
 -
 2009 results map
 -
 2013 results map
 -
 2017 results map


By-election results
1993-1997
| Party | Candidate | Votes | % | ±% | |
|---|---|---|---|---|---|
| Liberal Democrats | 801 | 56.6 | |||
| Labour | 486 | 34.4 | |||
| Conservative | 104 | 7.4 | |||
| UKIP | 23 | 1.6 | |||
| Majority | 315 | 22.2 | |||
| Turnout | 1,414 | 28.2 | |||
| Liberal Democrats hold | Swing | ||||
| Party | Candidate | Votes | % | ±% | |
|---|---|---|---|---|---|
| Labour | 793 | 51.6 | |||
| Conservative | 562 | 36.4 | |||
| Liberal Democrats | 181 | 11.8 | |||
| Majority | 231 | 15.2 | |||
| Turnout | 1,536 | 20.8 | |||
| Labour hold | Swing | ||||
2001-2005
| Party | Candidate | Votes | % | ±% | |
|---|---|---|---|---|---|
| Conservative | 1,621 | 68.3 | +9.6 | ||
| Labour | 753 | 31.7 | −9.6 | ||
| Majority | 868 | 36.6 | |||
| Turnout | 2,374 | ||||
| Conservative hold | Swing | ||||
| Party | Candidate | Votes | % | ±% | |
|---|---|---|---|---|---|
| Labour | 469 | 41.9 | −30.7 | ||
| Liberal Democrats | 420 | 37.5 | +37.5 | ||
| Conservative | 230 | 20.6 | −6.8 | ||
| Majority | 49 | 4.4 | |||
| Turnout | 1,119 | 17.1 | |||
| Labour hold | Swing | ||||
| Party | Candidate | Votes | % | ±% | |
|---|---|---|---|---|---|
| Labour | 524 | 39.2 | −20.2 | ||
| Liberal Democrats | 466 | 34.9 | +18.6 | ||
| Conservative | 347 | 26.0 | +1.7 | ||
| Majority | 58 | 4.3 | |||
| Turnout | 1,337 | 21.8 | |||
| Labour hold | Swing | ||||
| Party | Candidate | Votes | % | ±% | |
|---|---|---|---|---|---|
| Conservative | Andre Gonzalez de Savage | 1,228 | 48.4 | +1.7 | |
| Liberal Democrats | Charles Markham | 694 | 27.4 | +9.1 | |
| Labour | Simon Draper | 614 | 24.2 | −10.8 | |
| Majority | 534 | 21.0 | |||
| Turnout | 2,536 | 38.5 | |||
| Conservative hold | Swing | ||||
2005-2009
| Party | Candidate | Votes | % | ±% | |
|---|---|---|---|---|---|
| Conservative | Stephen Osborne | 1,541 | 67.0 | +2.4 | |
| Liberal Democrats | Robert Patchett | 456 | 19.8 | +19.8 | |
| Labour | Beatrice Price | 302 | 13.1 | −22.3 | |
| Majority | 1,085 | 47.2 | |||
| Turnout | 2,299 | 36.7 | |||
| Conservative hold | Swing | ||||
| Party | Candidate | Votes | % | ±% | |
|---|---|---|---|---|---|
| Conservative | Heather Smith | 1,866 | 70.4 | +8.2 | |
| Liberal Democrats | David Burgess | 461 | 17.4 | −2.8 | |
| Labour | David Fisher | 322 | 12.2 | −5.4 | |
| Majority | 1,405 | 53.0 | |||
| Turnout | 2,649 | 44.7 | |||
| Conservative hold | Swing | ||||
| Party | Candidate | Votes | % | ±% | |
|---|---|---|---|---|---|
| Conservative | Catherine Boardman | 2,307 | 70.3 | +8.6 | |
| Liberal Democrats | Robert Patchett | 641 | 19.5 | +19.5 | |
| Independent | Alan Tebbutt | 333 | 10.1 | +10.1 | |
| Majority | 1,666 | 50.8 | |||
| Turnout | 3,281 | 43.4 | |||
| Conservative hold | Swing | ||||
| Party | Candidate | Votes | % | ±% | |
|---|---|---|---|---|---|
| Labour | Bob Scott | 1,093 | 53.5 | −8.7 | |
| Conservative | Lynn Wilson | 375 | 18.3 | −2.7 | |
| Liberal Democrats | Chris Stanbra | 311 | 15.2 | −1.6 | |
| BNP | Rob Walker | 265 | 13.0 | +13.0 | |
| Majority | 718 | 35.2 | |||
| Turnout | 2,044 | 30.7 | |||
| Labour hold | Swing | ||||
2009-2013
| Party | Candidate | Votes | % | ±% | |
|---|---|---|---|---|---|
| Liberal Democrats | Chris Lofts | 1,279 | 60.7% | +32.6% | |
| Conservative | Ian Alexander McCord | 638 | 30.3% | −30.7% | |
| UKIP | Barry Joseph Mahoney | 124 | 5.9% | +5.9% | |
| BNP | Mark Andrew Plowman | 66 | 3.1% | +3.1% | |
| Majority | 641 | 30.4% | |||
| Turnout | 2107 | ||||
| Liberal Democrats gain from Conservative | Swing | +31.7% | |||
2013-2017
| Party | Candidate | Votes | % | ±% | |
|---|---|---|---|---|---|
| Conservative | Ronald Sawbridge | 1081 | 52.7% | +9.9% | |
| UKIP | Barry Joseph Mahoney | 604 | 29.4% | −6.0% | |
| Labour | Christopher Lee | 221 | 10.8% | −2.3% | |
| Liberal Democrats | Scott Jon Collins | 141 | 6.9% | −1.9% | |
| Majority | 477 | 23.6% | +16.2% | ||
| Turnout | 2051 | 22.86% | |||
| Conservative hold | Swing | ||||
| Party | Candidate | Votes | % | ±% | |
|---|---|---|---|---|---|
| Labour | Abigail Margaret Campbell | ||||
| Conservative | Malcolm Longley | ||||
| UKIP | Eric MacAnndrais | ||||
| Majority | |||||
| Turnout | |||||
| Party | Candidate | Votes | % | ±% | |
|---|---|---|---|---|---|
| Conservative | Cecile Irving-Swift | ||||
| Liberal Democrats | Daniel Joseph Jones | ||||
| Labour | Robert McNally | ||||
| UKIP | Stephen Ernest James Pointer | ||||
| Green | Stephen Whiffen | ||||
| Majority | |||||
| Turnout | |||||
| Party | Candidate | Votes | % | ±% | |
|---|---|---|---|---|---|
| Labour | Anjona Roy | 839 | 44.6 | +4.3 | |
| Liberal Democrats | Martin Sawyer | 564 | 30.0 | +0.1 | |
| Conservative | Ausra Uzukauskaite | 285 | 15.1 | −7.2 | |
| UKIP | Andy Smiles | 111 | 5.9 | −1.6 | |
| Green | Scott Mabbutt | 83 | 4.4 | +4.4 | |
| Majority | 275 | 14.6 | |||
| Turnout | 1883 | 21.4 | |||
| Labour hold | Swing | ||||
References
- ^ "Northamptonshire". BBC News Online. Retrieved 2009-09-03.
- ^ "Previous County Council election results". Northamptonshire County Council. Retrieved 2009-09-03.
- ^ a b c d "Northamptonshire County Council By-elections". Northamptonshire County Council. Retrieved 2009-09-03.
- ^ http://www.northamptonshire.gov.uk/en/councilservices/Council/elections/Documents/PDF%20Documents/Statement%20of%20persons%20nominated%20TD.pdf
- ^ http://www.northamptonshire.gov.uk/en/councilservices/council/elections/pages/default.aspx
- ^ http://www.northamptonshire.gov.uk/en/councilservices/Council/elections/Documents/PDF%20Documents/NoticeOfVacancyBraunstonCrick2013.pdf
- ^ http://www.northamptonshire.gov.uk/en/councilservices/Council/elections/Documents/PDF%20Documents/NoticeOfVacancyBrixworth2013.pdf
- ^ https://www.northampton.gov.uk/downloads/file/10415/declaration-of-result---st-george-county-division---19-july-2018
- ^ https://www.northamptonchron.co.uk/news/labour-hold-seat-st-george-election-northamptonshire-county-council-1012579