From Wikipedia, the free encyclopedia
Lombardy regional election, 1970|
|
|
| Turnout | 95.51% |
|---|
|
|
First party
|
Second party
|
Third party
|
|
|

|

|

|
| Party
|
DC
|
PCI
|
PSI
|
| Seats won
|
36
|
19
|
9
|
| Popular vote
|
2,138,141
|
1,210,068
|
648,696
|
| Percentage
|
40.9%
|
23.1%
|
12.4%
|
|
|
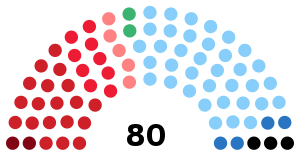
The Lombard regional election of 1970 took place on 7–8 June 1970. It was the first-ever regional election.
Electoral law
Election was held under proportional representation with provincial constituencies where the largest remainder method with a Droop quota was used. To ensure more proportionality, remained votes and seats were transferred at regional level and calculated at-large.
Results
The Christian Democracy party was by far the largest and christian-democrat Piero Bassetti was able to form a strong center-left government with the support of the PSI, the PSU and the PRI. Bassetti was replaced by Cesare Golfari in 1974.
7 June 1970 Lombard regional election results

|
| Parties
|
Votes
|
%
|
Seats
|
| bgcolor="Template:Christian Democracy (Italy)/meta/color" |
|
Christian Democracy
|
2,138,141
|
40.90
|
36
|
| bgcolor="Template:Italian Communist Party/meta/color" |
|
Italian Communist Party
|
1,210,068
|
23.14
|
19
|
| bgcolor="Template:Italian Socialist Party/meta/color" |
|
Italian Socialist Party
|
648,696
|
12.41
|
9
|
| bgcolor="Template:Italian Democratic Socialist Party/meta/color" |
|
Unitary Socialist Party
|
376,436
|
7.20
|
5
|
| bgcolor="Template:Italian Liberal Party/meta/color" |
|
Italian Liberal Party
|
310,324
|
5.94
|
4
|
| bgcolor="Template:Italian Social Movement/meta/color" |
|
Italian Social Movement
|
195,791
|
3.64
|
3
|
|
|
Italian Socialist Party of Proletarian Unity
|
188,585
|
3.61
|
2
|
| bgcolor="Template:Italian Republican Party/meta/color" |
|
Italian Republican Party
|
125,767
|
2.41
|
2
|
|
|
Italian Democratic Party of Monarchist Unity
|
31,119
|
0.60
|
–
|
|
|
Autonomists' Union of Italy
|
3,389
|
0.06
|
–
|
|
|
| Total parties
|
5,228,316
|
100.00
|
80
|
| Invalid/blank votes
|
225,720
|
4.14
|
|
| Registered voters
|
5,453,931
|
95.51
|
|
| Source: Ministry of the Interior – Results
|
Seats by province
|
|---|
| Regional elections | |
|---|
| General elections | |
|---|
| Senate elections | |
|---|
| European Parliament elections | |
|---|
| Referendums | |
|---|


