Perth Airport (suburb)
Appearance
| Perth Airport Perth, Western Australia | |||||||||||||||
|---|---|---|---|---|---|---|---|---|---|---|---|---|---|---|---|
 | |||||||||||||||
| Coordinates | 31°56′38″S 115°58′05″E / 31.944°S 115.968°E | ||||||||||||||
| Population | 28 (2016 census)[1] | ||||||||||||||
| Established | 1997 | ||||||||||||||
| Postcode(s) | 6105 | ||||||||||||||
| Location | 12 km (7 mi) from Perth | ||||||||||||||
| LGA(s) | |||||||||||||||
| State electorate(s) | Belmont | ||||||||||||||
| Federal division(s) | Swan | ||||||||||||||
| |||||||||||||||
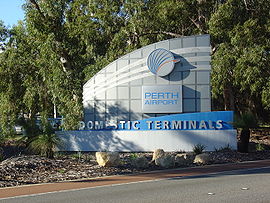
Perth Airport is an eastern suburb of Perth, the capital city of Western Australia. Its local government areas are the City of Belmont, the City of Swan (north) and the City of Kalamunda (east). It is located approximately 12 km east of the central business district.[2]
Climate
Perth Airport is home to a Bureau of Meteorology weather station. Perth Airport has a Mediterranean climate (Köppen climate classification Csa), like the rest of Perth. The highest recorded temperature in the Perth metropolitan region is 46.7 °C (116.1 °F), recorded at Perth Airport on 23 February 1991.
| Climate data for Perth Airport | |||||||||||||
|---|---|---|---|---|---|---|---|---|---|---|---|---|---|
| Month | Jan | Feb | Mar | Apr | May | Jun | Jul | Aug | Sep | Oct | Nov | Dec | Year |
| Record high °C (°F) | 46.0 (114.8) |
46.7 (116.1) |
43.8 (110.8) |
39.6 (103.3) |
35.3 (95.5) |
27.8 (82.0) |
25.7 (78.3) |
29.9 (85.8) |
34.5 (94.1) |
37.7 (99.9) |
41.1 (106.0) |
44.5 (112.1) |
46.7 (116.1) |
| Mean maximum °C (°F) | 41.0 (105.8) |
40.4 (104.7) |
38.6 (101.5) |
33.2 (91.8) |
28.4 (83.1) |
23.5 (74.3) |
22.1 (71.8) |
23.9 (75.0) |
27.2 (81.0) |
32.2 (90.0) |
36.2 (97.2) |
39.3 (102.7) |
42.1 (107.8) |
| Mean daily maximum °C (°F) | 31.8 (89.2) |
32.0 (89.6) |
29.7 (85.5) |
25.6 (78.1) |
21.8 (71.2) |
19.0 (66.2) |
18.0 (64.4) |
18.6 (65.5) |
20.2 (68.4) |
22.8 (73.0) |
26.1 (79.0) |
29.1 (84.4) |
24.6 (76.3) |
| Mean daily minimum °C (°F) | 17.0 (62.6) |
17.5 (63.5) |
16.0 (60.8) |
13.0 (55.4) |
10.4 (50.7) |
9.0 (48.2) |
8.0 (46.4) |
8.1 (46.6) |
8.9 (48.0) |
10.3 (50.5) |
12.8 (55.0) |
15.0 (59.0) |
12.2 (54.0) |
| Mean minimum °C (°F) | 10.4 (50.7) |
11.1 (52.0) |
8.9 (48.0) |
6.4 (43.5) |
4.4 (39.9) |
2.9 (37.2) |
2.3 (36.1) |
2.6 (36.7) |
3.4 (38.1) |
4.6 (40.3) |
6.9 (44.4) |
8.7 (47.7) |
1.2 (34.2) |
| Record low °C (°F) | 6.0 (42.8) |
5.7 (42.3) |
3.1 (37.6) |
1.2 (34.2) |
−0.4 (31.3) |
−1.3 (29.7) |
−1.0 (30.2) |
0.1 (32.2) |
−0.2 (31.6) |
1.2 (34.2) |
3.2 (37.8) |
4.8 (40.6) |
−1.3 (29.7) |
| Average rainfall mm (inches) | 10.9 (0.43) |
15.0 (0.59) |
16.2 (0.64) |
39.7 (1.56) |
97.5 (3.84) |
155.1 (6.11) |
155.3 (6.11) |
118.9 (4.68) |
72.2 (2.84) |
43.0 (1.69) |
25.4 (1.00) |
11.2 (0.44) |
762.1 (30.00) |
| Average precipitation days | 2.5 | 2.8 | 3.9 | 7.3 | 12.1 | 16.1 | 17.5 | 15.7 | 13.2 | 9.3 | 6.4 | 3.9 | 110.7 |
| Average afternoon relative humidity (%) (at 15:00) | 37 | 37 | 39 | 46 | 53 | 60 | 60 | 56 | 54 | 49 | 44 | 41 | 48 |
| Mean daily sunshine hours | 11.5 | 11.0 | 9.5 | 8.1 | 6.9 | 6.0 | 6.1 | 7.1 | 7.8 | 9.6 | 10.8 | 11.5 | 8.8 |
| Source: Bureau of Meteorology[3][4][5] Temperatures and rain data: 1944–2020; Relative humidity: 1994–2010 | |||||||||||||
References
- ^ Australian Bureau of Statistics (27 June 2017). "Perth Airport (State Suburb)". 2016 Census QuickStats. Retrieved 22 September 2019.
 Material was copied from this source, which is available under a Creative Commons Attribution 4.0 International License.
- ^ Price Regulation of Airport Services Inquiry July 2006 Archived 1 September 2007 at the Wayback Machine, 2006, Productivity Commission, Australia federal Government. (accessed 27/8/2007)
- ^ "Climate statistics for Australian locations – Perth Airport". Bureau of Meteorology. Retrieved 15 July 2020.
- ^ "Monthly highest temperature – Perth Airport". Bureau of Meteorology. Retrieved 15 July 2020.
- ^ "Monthly lowest temperature – Perth Airport". Bureau of Meteorology. Retrieved 15 July 2020.

