From Wikipedia, the free encyclopedia
2004 North Tipperary County Council election|
|
|
|
|
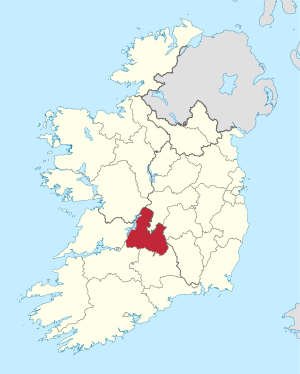 Map showing the area of North Tipperary County Council |
|
|
Council control after election
TBD
| |
An election to North Tipperary County Council took place on 11 June 2004 as part of that year's Irish local elections. 21 councillors were elected from four electoral divisions by PR-STV voting for a five-year term of office.
Results by party
style="width: 2px; color:inherit; background-color: #66BB66;" data-sort-value="Fianna Fáil" |
style="width: 2px; color:inherit; background-color: #6699FF;" data-sort-value="Fine Gael" |
style="width: 2px; color:inherit; background-color: #CC0000;" data-sort-value="Labour Party (Ireland)" |
style="width: 2px; color:inherit; background-color: #DCDCDC;" data-sort-value="Independent (politician)" |
Results by Electoral Area
Borrisokane
Borrisokane - 3 seats
| Party |
Candidate |
FPv% |
Count
|
| 1 |
2 |
3 |
4
|
|
|
Independent
|
Michael O'Meara
|
25.78
|
1,283
|
|
|
|
|
|
Fianna Fáil
|
Jim Casey*
|
23.77
|
1,183
|
1,241
|
1,250
|
|
|
|
Fine Gael
|
Gerard Darcy*
|
16.17
|
805
|
886
|
894
|
1,092
|
|
|
Fine Gael
|
Louis McCormack
|
15.69
|
781
|
840
|
854
|
1,008
|
|
|
Fianna Fáil
|
Tony McKenna*
|
12.14
|
604
|
643
|
650
|
|
|
|
Sinn Féin
|
Aideen Rosney
|
3.25
|
162
|
|
|
|
|
|
Labour
|
Rose Tully
|
3.19
|
159
|
|
|
|
| Electorate: 7,104 Valid: 4,977 (70.06%) Spoilt: 61 Quota: 1,245 Turnout: 5,038 (70.92%)
|
Nenagh
Nenagh - 7 seats
| Party |
Candidate |
FPv% |
Count
|
| 1 |
2 |
3 |
4 |
5 |
6
|
|
|
Fianna Fáil
|
John Carroll*
|
10.92
|
1,414
|
1,472
|
1,497
|
1,579
|
1,652
|
|
|
|
Fine Gael
|
Tom Berkery*
|
10.01
|
1,296
|
1,365
|
1,428
|
1,507
|
1,621
|
|
|
|
Fianna Fáil
|
Mattie (Coole) Ryan*
|
9.97
|
1,291
|
1,314
|
1,356
|
1,442
|
1,826
|
|
|
|
Fianna Fáil
|
John Sheehy
|
9.38
|
1,215
|
1,228
|
1,246
|
1,285
|
1,447
|
1,549
|
|
|
Labour
|
Seán Creamer*
|
9.24
|
1,197
|
1,246
|
1,481
|
1,639
|
|
|
|
|
Fianna Fáil
|
Tom Harrington*
|
8.99
|
1,164
|
1,216
|
1,274
|
1,332
|
1,420
|
1,452
|
|
|
Independent
|
Martin Kennedy*
|
8.48
|
1,098
|
1,130
|
1,140
|
1,209
|
|
|
|
|
Fine Gael
|
Phyll Bugler
|
8.06
|
1,044
|
1,084
|
1,191
|
1,245
|
1,413
|
1,456
|
|
|
Fianna Fáil
|
Tony Sheary*
|
7.71
|
998
|
1,088
|
1,186
|
1,332
|
1,347
|
1,377
|
|
|
Sinn Féin
|
Ella O'Dwyer
|
6.78
|
878
|
928
|
1,004
|
|
|
|
|
|
Labour
|
Virginia O'Dowd
|
5.53
|
716
|
821
|
|
|
|
|
|
|
Independent
|
Joe O'Connor
|
4.22
|
546
|
|
|
|
|
|
|
|
Independent
|
Noel Monteith
|
0.70
|
91
|
|
|
|
|
|
| Electorate: 19,702 Valid: 12,948 (65.72%) Spoilt: 234 Quota: 1,619 Turnout: 13,182 (66.91%)
|
Templemore
Templemore - 5 seats
| Party |
Candidate |
FPv% |
Count
|
| 1 |
2 |
3 |
4 |
5 |
6 |
7
|
|
|
Fine Gael
|
Pauline Coonan*
|
15.52
|
1,279
|
1,319
|
1,358
|
1,608
|
|
|
|
|
|
Fianna Fáil
|
John Hogan*
|
15.10
|
1,244
|
1,295
|
1,305
|
1,375
|
|
|
|
|
|
Fianna Fáil
|
Michael Smith
|
14.64
|
1,206
|
1,217
|
1,269
|
1,291
|
1,309
|
1,315
|
1,649
|
|
|
Fine Gael
|
Denis Ryan*
|
14.53
|
1,197
|
1,202
|
1,353
|
1,451
|
|
|
|
|
|
Fianna Fáil
|
Dr. Joe Hennessy*
|
10.46
|
862
|
878
|
903
|
947
|
989
|
1,000
|
1,233
|
|
|
Fianna Fáil
|
Seán Mulrooney*
|
8.94
|
737
|
739
|
797
|
799
|
805
|
807
|
|
|
|
Independent
|
Seán Fogarty
|
7.08
|
583
|
617
|
646
|
702
|
789
|
826
|
890
|
|
|
Fine Gael
|
Liam Brereton
|
6.46
|
532
|
550
|
563
|
|
|
|
|
|
|
Labour
|
P.J. Wright
|
4.39
|
362
|
407
|
|
|
|
|
|
|
|
Labour
|
Liam Leahy
|
2.89
|
238
|
|
|
|
|
|
|
| Electorate: 12,441 Valid: 8,240 (66.23%) Spoilt: 150 Quota: 1,374 Turnout: 8,390 (67.44%)
|
Thurles
Thurles - 6 seats
| Party |
Candidate |
FPv% |
Count
|
| 1 |
2 |
3 |
4 |
5 |
6 |
7 |
8 |
9
|
|
|
Independent
|
Michael Lowry, Jnr*
|
16.91
|
1,671
|
|
|
|
|
|
|
|
|
|
|
Independent
|
Jim Ryan
|
15.27
|
1,509
|
|
|
|
|
|
|
|
|
|
|
Fianna Fáil
|
Harry Ryan*
|
11.76
|
1,162
|
1,194
|
1,214
|
1,228
|
1,261
|
1,336
|
1,390
|
1,511
|
|
|
|
Fianna Fáil
|
Seamus Hanafin*
|
10.21
|
1,009
|
1,034
|
1,044
|
1,060
|
1,101
|
1,164
|
1,253
|
1,379
|
1,406
|
|
|
Independent
|
Willie Kennedy*
|
9.52
|
941
|
1,021
|
1,092
|
1,097
|
1,291
|
1,330
|
1,348
|
1,472
|
|
|
|
Fianna Fáil
|
John Egan*
|
8.01
|
792
|
804
|
822
|
827
|
905
|
944
|
963
|
1,023
|
1,041
|
|
|
Labour
|
John Kennedy
|
5.42
|
536
|
558
|
566
|
576
|
605
|
661
|
941
|
1,116
|
1,140
|
|
|
Labour
|
John Kenehan
|
5.20
|
514
|
535
|
546
|
561
|
583
|
653
|
|
|
|
|
|
Independent
|
Billy Clancy
|
4.77
|
471
|
485
|
506
|
510
|
|
|
|
|
|
|
|
Fine Gael
|
Mae Quinn*
|
4.76
|
470
|
492
|
655
|
665
|
690
|
800
|
866
|
|
|
|
|
Independent
|
Noel O'Dwyer
|
4.69
|
464
|
483
|
498
|
515
|
559
|
|
|
|
|
|
|
Fine Gael
|
John Ryan
|
3.49
|
345
|
356
|
|
|
|
|
|
|
|
| Electorate: 15,201 Valid: 9,884 (65.02%) Spoilt: 133 Quota: 1,413 Turnout: 10,017 (65.90%)
|
External links


