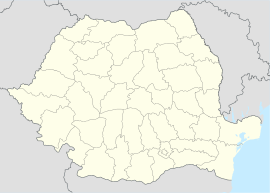
Luduș
Luduș
Marosludas | |
|---|---|
 Location in Mureș County | |
| Coordinates: 46°28′40″N 24°5′46″E / 46.47778°N 24.09611°E | |
| Country | Romania |
| County | Mureș |
| Government | |
| • Mayor | Cristian Moldovan[1] (PSD) |
Area | 67 km2 (26 sq mi) |
| Population (2021-12-01)[2] | 14,757 |
| • Density | 220/km2 (570/sq mi) |
| Time zone | EET/EEST (UTC+2/+3) |
| Vehicle reg. | MS |
| Website | www |
Luduș (Romanian pronunciation: [ˈluduʃ]; Hungarian: Marosludas or Ludas; Hungarian pronunciation: [ˈmɒroʃludɒʃ], German: Ludasch) is a town in Transylvania, Romania in Mureș County, 44 km south-west from the county's capital Târgu Mureș.
Six villages are administered by the town: Avrămești (Eckentelep), Cioarga (Csorga), Ciurgău (Csorgó), Fundătura (Mezőalbisitelep or Belsőtelep), Gheja (Marosgezse) and Roșiori (Andrássytelep).
History
- 1330 - First mentioned as Plehanus de Ludas.
- 1377 - Mentioned in a transaction between two Hungarian nobles.
- 1930 - 5,085 inhabitants.
- 1940 to 1944, Hungarians occupied the town. The Jewish population is murdered during the Luduș massacre from 5 to 13 September 1944.
- 1960 - Luduș became a town.
- 1966 - 11,794 inhabitants.
- 2002 - 17,497 inhabitants.
Demographics
In 2011, it had a population of 15,328; out of them, 65.9% were Romanian, 23.2% were Hungarian, and 6.3% were Roma.[3]
In 1850, the town had 1,166 inhabitants. Ethnic composition of the town according to the 1850 census:
- Romanians: 1,065 (91.34%)
- Hungarians: 34 (2.92%) [4]
In 1910, the town had 4632 inhabitants. Ethnic composition of the town according to the 1910 census:
- Hungarians:3,116 (67.27%)
- Romanians:1,385 (29.9%) [5]
Demographic movement of the population according to the census data:

See also
Notes
- ^ "Results of the 2016 local elections". Central Electoral Bureau. Retrieved 5 April 2020.
- ^ "Populaţia rezidentă după grupa de vârstă, pe județe și municipii, orașe, comune, la 1 decembrie 2021" (XLS). National Institute of Statistics.
- ^ Tab8. Populaţia stabilă după etnie – judeţe, municipii, oraşe, comune, 2011 census results, Institutul Național de Statistică, accessed 3 March 2020.
- ^ Varga E. Árpád:Statistics on Ethnicity and Religious Affiliations of Transylvania, Census data, 1850–2002 (in Hungarian)
- ^ Varga E. Árpád:Statistics on Ethnicity and Religious Affiliations of Transylvania, Census data, 1850–2002 (in Hungarian)
External links
- (in Romanian) Luduş online
- (in Hungarian) Datasheet of Ludus in Transylvanian Hungarian Database
- (in English and Hungarian) Bánffy-Castle


