Tiltmeter
This article needs additional citations for verification. (November 2010) |

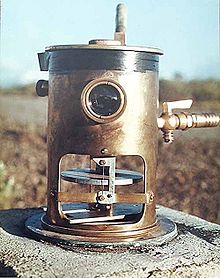
A tiltmeter is a sensitive inclinometer designed to measure very small changes from the vertical level, either on the ground or in structures.[1] Tiltmeters are used extensively for monitoring volcanoes, the response of dams to filling, the small movements of potential landslides, the orientation and volume of hydraulic fractures, and the response of structures to various influences such as loading and foundation settlement. Tiltmeters may be purely mechanical or incorporate vibrating-wire or electrolytic sensors for electronic measurement. A sensitive instrument can detect changes of as little as one arc second.
Tiltmeters have a long history, somewhat parallel to the history of the seismometer. The very first tiltmeter was a long-length stationary pendulum. These were used in the very first large concrete dams, and are still in use today, augmented with newer technology such as laser reflectors. Although they had been used for other applications such as volcano monitoring, they have distinct disadvantages, such as their huge length and sensitivity to air currents. Even in dams, they are slowly being replaced by the modern electronic tiltmeter.
Volcano and earth movement monitoring then used the water-tube, long baseline tiltmeter.[2] In 1919, the renowned physicist, Albert A. Michelson, noted that the most favorable arrangement to obtain high sensitivity and immunity from temperature perturbations is to use the equipotential surface defined by water in a buried half-filled water pipe.[3] This was a simple arrangement of two water pots, connected by a long water-filled tube. Any change in tilt would be registered by a difference in fill-mark of one pot compared to the other. Although extensively used throughout the world for earth-science research, they have proven to be quite difficult to operate. For example, due to their high sensitivity to temperature differentials, these always have to be read in the middle of the night.
The modern electronic tiltmeter, which is slowly replacing all other forms of tiltmeter, uses a simple bubble level principle, as used in the common carpenter level.[4] As shown in the figure, an arrangement of electrodes senses the exact position of the bubble in the electrolytic solution, to a high degree of precision. Any small changes in the level are recorded using a standard datalogger. This arrangement is quite insensitive to temperature, and can be fully compensated, using built-in thermal electronics.[5]
A newer technology uses Microelectromechanical systems (MEMS) sensor enables tilt angle measuring tasks to be performed conveniently in both single and dual axis mode. Ultra-high precision 2-axis MEMS driven digital inclinometer/ tiltmeter is available for speedy angle measurement applications and surface profiling require very high resolution and accuracy of one arc second. The 2-axis MEMS driven inclinometers/ tiltmeters can be digitally compensated and precisely calibrated for non-linearity and operating temperature variation, resulting in higher angular accuracy and stability performance over wider angular measurement range and broader operating temperature range. Further, digital display of readings can effectively prevent parallax error as experience when viewing those traditional ‘bubble’ vials located from a distance.
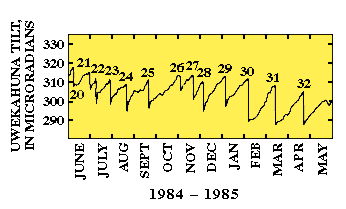
The most dramatic application of tiltmeters is in the area of volcanic eruption prediction.[6] As shown in this figure from the USGS, the main volcano in Hawaii (Kilauea) had a habit of filling the main chamber with magma, and then discharging to a side vent. The graph shows this repeated action, with a pattern of swelling of the main chamber (recorded by the tiltmeter), draining of that chamber, and then an eruption of the adjoining vent. Each number at the peak of tilt, on the graph, is a recorded eruption.
Gallery
-
Principle of a modern electronic tiltmeter
-
Graph showing inflation cycle of Kīlauea volcano
See also
- Dam safety system
- Differential GPS
- Geomechanic
- Inclinometer
- Remote sensing methods
- Rock mechanics
- Tilt test (geotechnical engineering)
References
- ^ John Dunnicliff Geotechnical instrumentation for monitoring field performance Wiley-IEEE, 1993 ISBN 0-471-00546-0, pp. 216–219
- ^ "How We Monitor Volcanoes". Volcanoes.usgs.gov. 2008-08-13. Retrieved 2014-05-30.
- ^ "What is a Tiltmeter?". www.wisegeek.com. 2014-05-30. Retrieved 2014-05-30.
- ^ [1] Archived August 25, 2006, at the Wayback Machine
- ^ [2]
- ^ "How We Monitor Volcanoes". Volcanoes.usgs.gov. 2008-08-13. Retrieved 2014-02-05.


