
Search results
The page "Chart table" does not exist. You can create a draft and submit it for review or request that a redirect be created, but consider checking the search results below to see whether the topic is already covered.
 The periodic table, also known as the periodic table of the elements, is an ordered arrangement of the chemical elements into rows ("periods") and columns...251 KB (27,189 words) - 17:10, 7 June 2024
- A table or chart of nuclides is a two-dimensional graph of isotopes of the elements, in which one axis represents the number of neutrons (symbol N) and...13 KB (1,346 words) - 21:19, 17 January 2024
- bidental fricative [h̪͆] IPA vowel chart with audio IPA consonant chart with audio International Phonetic Alphabet chart for English dialects Extensions...12 KB (150 words) - 01:16, 4 June 2024
- Insert tab and select "Pivot Table" (or "Pivot Chart"). The user then has the option of either inserting the pivot table into an existing sheet or creating...18 KB (2,072 words) - 22:02, 7 February 2024
 represented by symbols, such as bars in a bar chart, lines in a line chart, or slices in a pie chart". A chart can represent tabular numeric data, functions...13 KB (1,513 words) - 17:59, 31 May 2024
- The Official Table of Drops, formerly issued by the British Home Office, is a manual which is used to calculate the appropriate length of rope for long...5 KB (285 words) - 20:09, 25 January 2024
- TurnTable charts is a catalog of relative weekly, and yearly popular songs in Nigeria. The results are published in TurnTable magazine. TurnTable provides...22 KB (1,271 words) - 11:31, 14 April 2024
- Ranking (redirect from Standings chart)sports, standings, rankings, or league tables group teams of a particular league, conference, or division in a chart based on how well each is doing in a...16 KB (2,437 words) - 21:28, 18 May 2024
- A table cell is one grouping within a chart table used for storing information or data. Cells are grouped horizontally (rows of cells) and vertically...3 KB (299 words) - 01:31, 22 June 2023
 Tide tables, sometimes called tide charts, are used for tidal prediction and show the daily times and levels of high and low tides, usually for a particular...6 KB (585 words) - 07:54, 21 April 2024
- A KWL table, or KWL chart, is a graphical organizer designed to help in learning. The letters KWL are an acronym, for what students, in the course of...13 KB (1,956 words) - 12:02, 3 May 2024
 Snellen chart is the most widely used. Alternative types of eye charts include the logMAR chart, Landolt C, E chart, Lea test, Golovin–Sivtsev table, the...15 KB (1,957 words) - 00:21, 9 May 2024
- 2016. "GFK Chart-Track Albums: Week 41, 2016". Chart-Track. IRMA. Retrieved October 14, 2016. "Charts.nz – Solange – A Seat at the Table". Hung Medien...52 KB (4,386 words) - 23:32, 19 May 2024
- are Snellen chart apps for smart phones and tablets. E chart Golovin–Sivtsev table Jaeger chart Landolt C Lea test LogMAR chart Monoyer chart Sloan letters...12 KB (1,546 words) - 13:11, 1 April 2024
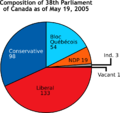
 book of charts and tables—rather than to this specific type of diagram. A ring chart, also known as a sunburst chart or a multilevel pie chart, is used...21 KB (2,312 words) - 16:41, 7 June 2024
 1999, Gantt charts were identified as "one of the most widely used management tools for project scheduling and control". In the following tables there are...18 KB (1,798 words) - 17:39, 7 June 2024
 A line chart or line graph, also known as curve chart, is a type of chart that displays information as a series of data points called 'markers' connected...5 KB (674 words) - 07:38, 30 March 2024
 approved. A burn down chart for a completed iteration is shown above and can be read by knowing the following: The above table is only one way of interpreting...7 KB (513 words) - 13:18, 16 April 2024
- An ICE table or RICE box or RICE chart is a tabular system of keeping track of changing concentrations in an equilibrium reaction. ICE stands for initial...5 KB (713 words) - 07:35, 4 June 2023
 A bar chart or bar graph is a chart or graph that presents categorical data with rectangular bars with heights or lengths proportional to the values that...10 KB (1,282 words) - 16:55, 8 April 2024


- chart table (plural chart tables) (nautical) A table, below deck, on which charts are placed to navigate.
- Sacred Books of the East, Vol. III, The Shû King Introduction, A Chart by the Rev. Professor Pritchard 1610807Sacred Books of the East, Vol. III, The
- railroad engineer and manager, credited for creating the first organizational chart for an American business. The road must run save first and fast afterward
- The comparative pie charts are very difficult to read and compare if the ratio of the pie chart is not given. Examine our example of color preference