Edugraphic
This article has multiple issues. Please help improve it or discuss these issues on the talk page. (Learn how and when to remove these messages)
|
Education graphics, or edugraphics, are graphic visual representations of educational information intended to simplify social-cultural content, communication related content, linguistic content, etc. The use of rich visual content improves cognition, as the students comprehension is enhanced when both visual and text-based cues are combined.
Edugraphics have existed since learning manuals began to be used in elementary schools, high schools and universities.[1] These edugraphics, known by the term infographics or "information graphics", are used to explain different subjects (geography, history, science, biology...).[2] They were used to illustrate some aspect of the lesson (map of invasions, timelines, internal organs, etc.), and they were drawn or made by computer graphics.
Origin

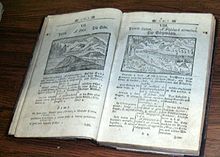
The term "edugraphic" is born from its cousin "infographic" which is relatively recent and the result of considerable debate in the design community. The Society for Technical Communication group describes infographics as "the translation of complex, unorganized or unstructured data into valuable, meaningful information".[3] Comenius used a visual education with the publication of Orbis Pictus in 1658.[4]
Infographics made significant developments thanks to the journalistic use old newspapers[5] nowadays infographics are now being used in several media and they serve to condense large amounts of information gathered from data banks that are nowadays easily found on the internet.
The First International Conference on Graphics Education was held in Alvor, Algarve, Portugal 1993 with the name Edugraphics.[6]
Edugraphics, even though the term has not yet been widely spread, were used first in textbooks in every country. For example, in history textbooks, the use of timelines was highly effective for its power to illustrate several historical information elements in one straight line. Maps showed the population of a country, its social status, etc. The images used were called "graphics", "pie-charts", "bar-charts", "maps".
Differences
MOOCs will make edugraphics - which are highly adapted for these open courses - necessary.
The difference between infographics and edugraphics are basically the way contents are treated because they are not data but pedagogical content, like theories, process, rules, (grammar and maths), etc. Infographics may be used in school for pedagogical purposes but are not intended to explain pedagogical facts.
Edugraphics combines 3 basic elements: visual content (icons, images, colors), pedagogical content, and a learning scenario (story).
Visual content
Visuals are a basic and important element. Basic notions of design should be used to create an edugraphic, for instance how to use colors properly (contrast), how to use fonts meaningfully and how to organize every single element in a canvas.
Pedagogical content
Pedagogical content is the main reason for creating an edugraphic. The contents have to be related to a specific subject for the course. For example, in a French course, if the teacher is explaining the vocabulary of the body (head, mouth, eyes, etc.), instead of listing the vocabulary, a simple edugraphic will use a picture or a drawing of a character's body and each part will be pointed out with arrows. But that is a simple edugraphic. What about explaining the use of an auxiliary verb in French (‘avoir’: to be) to the student? The edugraphic could show illustrations of someone's birthday: "j'ai 15 ans", someone who is showing a car as if it were his: "j'ai une voiture", or someone who is really cold : "j'ai froid".
Scenario
As interesting as the content should be, the way it is told or explained to students is often as important as the content. Students are going to engage more if the content is appealing to them.
Categories
They are 5 types of edugraphics[according to whom?]: Oneshot subject, timeline, process, gameboard, instructions.
Oneshot subject: Edugraphic that puts a simple educational fact into illustration. One single image equals a rule or a notion.
Timeline: When dealing with historical issues, a great way of showing each step in history is through a timeline. It is easy to understand the facts when represented in such a manner.
Process: Explaining to students how the water cycle works is a perfect example of a process-type edugraphic.
Gameboard: Gameboard edugraphics allow teachers to use a model where students can interact. This representation is used to show a certain type of process mixed with timeline elements.
Instructions : An edugraphic that helps students follow simple steps that are well illustrated with icons and images. A sort of Ikea instruction manual but for education.
References
- ^ Histoire Géographie Education civique 2de Bac Pro - Livre élève consommable - Ed. 2013; De Michel Casta, Michel Corlin, Thierry Falconnet, Gilles Labadou, Alain Prost
- ^ Durandeau Hachette, 13 Mai 1998
- ^ Kim Baer (2008), Information Design Workbook, Graphic Approaches, solutions and inspiration + 30 case studies. Rokport, p,12.
- ^ Epstein, Connie C. (1991). The Art of Writing for Children. Archon Books. p. 2. ISBN 0-208-02297-X.
- ^ Colmes N. (1984) Designer's Guide to Creating Charts and Diagrams, New York: Watson-Guptill
- ^ Santo, Harold P. (1993). Edugraphics '93 : First International Conference on Graphics Education. Lisbon: Association for Computing Machinery.
