Jump to content

File:English dialects1997.png

Page contents not supported in other languages.
This is a file from the Wikimedia Commons
From Wikipedia, the free encyclopedia

English_dialects1997.png (250 × 180 pixels, file size: 15 KB, MIME type: image/png)

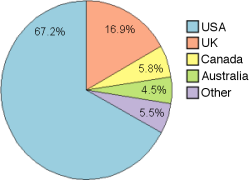
Pie chart showing the relative numbers of native English speakers in the major English-speaking countries of the world.

I've created this diagram as an update for [1]. The previous chart didn't take into account several varieties, which is why the "Others" percentage was too small. Source data (1997) from: British council study "The future of English?" archive copy at the Wayback Machine, page 10.

The previous chart was from 1995, the current one from 1997. I've been looking for newer sources but couldn't find any. The British Council report from 2000 seems to be the newest and most reliable source. Dumbledore 12:08, 30 Mar 2005 (UTC)

Data (only true native speakers!):

                    American    British    Canadian    Australian    Other    Total
Percentage          67.2        16.9       5.8         4.5           5.5      100.0
Absolute (000s)     226,710     56,990     19,700      15,316        18,581   337,297
Public domain I, the copyright holder of this work, release this work into the public domain. This applies worldwide.
In some countries this may not be legally possible; if so:
I grant anyone the right to use this work for any purpose, without any conditions, unless such conditions are required by law.
date/time username edit summary
02:43, 9 September 2005 en:User:Michael Shields (punctuation)
14:26, 1 April 2005 en:User:203.164.184.141 (fix alignment and order as in graph)
12:10, 1 April 2005 en:User:203.164.184.141 (English Wikipedia use full stops not commas)
08:11, 1 April 2005 en:User:Dumbledore
03:06, 31 March 2005 en:User:Dumbledore
12:26, 30 March 2005 en:User:Dumbledore
12:08, 30 March 2005 en:User:Dumbledore
09:11, 30 March 2005 en:User:Dumbledore (I've created this diagram as an update for [http://en.wikipedia.org/wiki/Image:English_dialects.png]. The previous diagram didn't take into account several varieties, which is why the "Others" percentage was too small. Source data (1997) from: British cou)

Original upload log

Legend: (cur) = this is the current file, (del) = delete this old version, (rev) = revert to this old version.

Click on date to download the file or see the image uploaded on that date.

  • (del) (cur) 09:11, 30 March 2005 . . en:User:Dumbledore Dumbledore ( en:User_talk:Dumbledore Talk) . . 250x180 (17069 bytes) (I've created this diagram as an update for [2]. The previous diagram didn't take into account several varieties, which is why the "Others" percentage was too small. Source data (1997) from: British cou)

Captions

Add a one-line explanation of what this file represents

Items portrayed in this file

depicts

image/png

File history

Click on a date/time to view the file as it appeared at that time.

Date/TimeThumbnailDimensionsUserComment
current08:37, 24 September 2006Thumbnail for version as of 08:37, 24 September 2006250 × 180 (15 KB)SteinbachDiagramme showing the shares of the main English speaking countries in the total population of native English speakers in 1997. Only real native speakers are counted. {{PD-user-en|Dumbledore}} Category:English language
14:02, 5 February 2006Thumbnail for version as of 14:02, 5 February 2006250 × 180 (17 KB)MaksimLa bildo estas kopiita de wikipedia:en. La originala priskribo estas: I've created this diagram as an update for [http://en.wikipedia.org/wiki/Image:English_dialects.png]. The previous chart didn't take into account several varieties, which is why the "O

Global file usage

The following other wikis use this file: