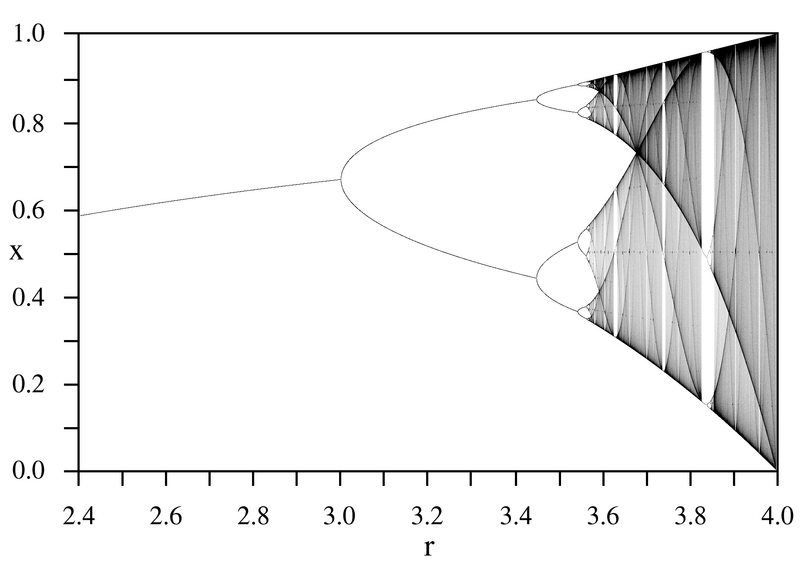
File:LogisticMap BifurcationDiagram.png
Appearance

Size of this preview: 800 × 566 pixels. Other resolutions: 320 × 226 pixels | 640 × 453 pixels | 1,024 × 724 pixels | 1,280 × 905 pixels | 1,838 × 1,300 pixels.
Original file (1,838 × 1,300 pixels, file size: 571 KB, MIME type: image/png)
| This image was selected as picture of the month on the Mathematics Portal for December 2011. |
File history
Click on a date/time to view the file as it appeared at that time.
| Date/Time | Thumbnail | Dimensions | User | Comment | |
|---|---|---|---|---|---|
| current | 00:11, 14 September 2005 |  | 1,838 × 1,300 (571 KB) | PAR~commonswiki | Bifurcation diagram for the logistic map for parameter r=2.4 to 4.0. |
File usage
The following 14 pages use this file:
- Ivar Ekeland
- Mathematical constant
- Mitchell Feigenbaum
- Recurrence quantification analysis
- Talk:Bifurcation diagram
- Talk:Logistic map
- User:Kiefer.Wolfowitz
- User:RazrRekr201/Table of constants
- User talk:Kiefer.Wolfowitz/Archive 9
- Wikipedia:WikiProject Systems/List of images of systems
- Wikipedia talk:WikiProject Mathematics/Archive/2011/Apr
- Portal:Mathematics/Featured picture/2011 12
- Portal:Mathematics/Featured picture archive
- Portal:Mathematics/Suggestions
Global file usage
The following other wikis use this file:
- Usage on ar.wikipedia.org
- Usage on ca.wikipedia.org
- Usage on da.wikipedia.org
- Usage on de.wikipedia.org
- Usage on el.wikipedia.org
- Usage on en.wikibooks.org
- Usage on en.wikiversity.org
- Usage on eo.wikipedia.org
- Usage on es.wikipedia.org
- Usage on fi.wikipedia.org
- Usage on fr.wikipedia.org
- Usage on fr.wikiversity.org
- Usage on he.wikipedia.org
- Usage on hi.wikipedia.org
- Usage on it.wikipedia.org
- Usage on ja.wikipedia.org
- Usage on lt.wikipedia.org
- Usage on mt.wikipedia.org
- Usage on nl.wikipedia.org
View more global usage of this file.


