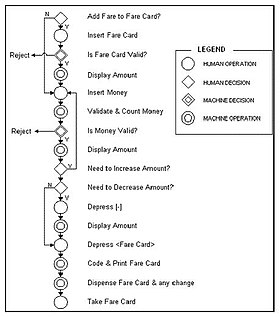
Flow process chart

The flow process chart is a graphical and symbolic representation of the activities performed on the work piece during the operation in industrial engineering. [1]
History
[edit]The first structured method for documenting process flow, e.g., in flow shop scheduling, the flow process chart, was introduced by Frank and Lillian Gilbreth to members of ASME in 1921 as the presentation "Process Charts, First Steps in Finding the One Best Way to Do Work".[2] The Gilbreths' tools quickly found their way into industrial engineering curricula.[3]
In the early 1930s, an industrial engineer, Allan H. Mogensen, began training business people in the use of some of the tools of industrial engineering at his Work Simplification Conferences in Lake Placid, New York. A 1944 graduate of Mogensen's class, Art Spinanger, took the tools back to Procter and Gamble, where he developed their Deliberate Methods Change Program. Another 1944 graduate, Ben S. Graham, Director of Formcraft Engineering at Standard Register Corporation, adapted the flow process chart to information processing with his development of the multi-flow process chart to display multiple documents and their relationships. In 1947, ASME adopted a symbol set derived from Gilbreth's original work as the ASME Standard for Process Charts.[4]
Symbols
[edit]| Symbol | Letter | Description |
|---|---|---|
| Ο | O | Operation |
| Ỻ | I | Inspection |
| → | M | Transport |
| D | D | Delay |
| ∇ | S | Storage |
- Operation: to change the physical or chemical characteristics of the material.
- Inspection: to check the quality or the quantity of the material.
- Move: transporting the material from one place to another.
- Delay: when material cannot go to the next activity.
- Storage: when the material is kept in a safe location.
When to use it
[edit]- It is used when observing a physical process, to record actions as they happen, and thus get an accurate description of the process.
- It is used when analyzing the steps in a process, to help identify and eliminate waste—thus, it is a tool for efficiency planning.
- It is used when the process is mostly sequential, containing few decisions.
See also
[edit]- Business process mapping
- Control flow diagram
- Data flow diagram
- Flowchart
- Functional flow block diagram
- Workflow
References
[edit]- ^ "Flow Process Grids and Charts". Textile Course. Retrieved 1 December 2018.
- ^ Frank Bunker Gilbreth, Lillian Moller Gilbreth (1921) Process Charts. American Society of Mechanical Engineers. Archived 9 May 2015 at the Wayback Machine
- ^ Graham, Ben B. (2004). Detail process charting : speaking the language of process ([Online-Ausg.] ed.). Hoboken, N.J.: Wiley. p. 2. ISBN 9780471653943.
- ^ American Society of Mechanical Engineers (1947) ASME standard; operation and flow process charts. New York, 1947. (online version)
