
Niedergörsdorf
Niedergörsdorf | |
|---|---|
Location of Niedergörsdorf within Teltow-Fläming district  | |
 Niedergörsdorf  Niedergörsdorf | |
| Coordinates: 51°59′N 13°0′E / 51.983°N 13.000°E | |
| Country | Germany |
| State | Brandenburg |
| District | Teltow-Fläming |
| Subdivisions | 22 Ortsteile |
| Government | |
| • Mayor | Wilfried Rauhut (Ind.) |
| Area | |
| • Total | 204.67 km2 (79.02 sq mi) |
| Elevation | 84 m (276 ft) |
| Population (2022-12-31)[1] | |
| • Total | 6,220 |
| • Density | 30/km2 (79/sq mi) |
| Time zone | UTC+01:00 (CET) |
| • Summer (DST) | UTC+02:00 (CEST) |
| Postal codes | 14913 |
| Dialling codes | 033741 |
| Vehicle registration | TF |
| Website | www.niedergoersdorf.de |
Niedergörsdorf is a municipality in the Teltow-Fläming district of Brandenburg, Germany.
Demography
-
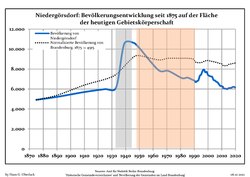 Development of Population since 1875 within the Current Boundaries (Blue Line: Population; Dotted Line: Comparison to Population Development of Brandenburg state; Grey Background: Time of Nazi rule; Red Background: Time of Communist rule)
 -
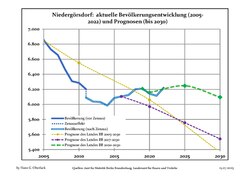 Recent Population Development and Projections (Population Development before Census 2011 (blue line); Recent Population Development according to the Census in Germany in 2011 (blue bordered line); Projection by the Brandenburg state for 2005-2030 (yellow line); Projection by the Brandenburg state for 2014-2030 (red line); Projection by the Bertelsmann Foundation for 2012-2030 (green line)


|
|
|
Photo gallery
- Churches
-
 Blönsdorf
 -
 Mellnsdorf
 -
 Seehausen


See also
References
- ^ "Bevölkerungsentwicklung und Bevölkerungsstandim Land Brandenburg Dezember 2022" (PDF). Amt für Statistik Berlin-Brandenburg (in German). June 2023.
- ^ Detailed data sources are to be found in the Wikimedia Commons.Population Projection Brandenburg at Wikimedia Commons
Towns and municipalities in Teltow-Fläming | ||
|---|---|---|
 | ||
| International | |
|---|---|
| National | |
This Brandenburg location article is a stub. You can help Wikipedia by expanding it. |