Political power in the United States over time
Control of United States Congress
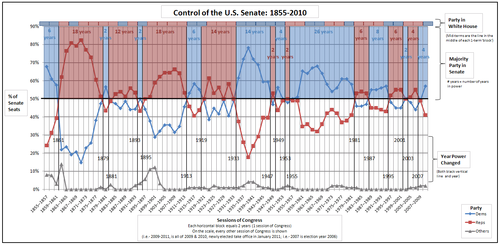
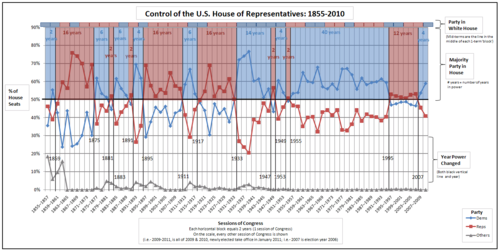
Since 1855 the United States Congress has been dominated by a two party system comprised on one side by the Democratic Party and the Republican Party on the other. While other political parties over time have and may still exist, no other parties have possessed the support, organization and historical legacy these two parties do.
| Senate | House of Representatives |
 |
 |
Dominant Party
Over the past 100 years the Democratic party has held power nearly twice as long as the Republicans in both the Senate and the House. And the Democratic party has had control of the White House and the two Houses of Congress for 35 years, compared to 16 years for the Republican party over the last 100 years.
Party Control of Congress
Note: The following statistics consider 2001 as a year in which the Democrats controlled the Senate, although they did not control it for the entire year.
Senate Control by Party Past 100 Years
The following statistics reflect the years each political party has controlled a majority in the Senate over the past 100 years (1916–2015).
| Party | Years in Control |
| Democrats: | 65 yrs |
| Republicans: | 35 yrs |
House Control by Party Past 100 Years
The following statistics reflect the years each political party has controlled a majority in the House of Representatives over the past 100 years (1916–2015).
| Party | Years in Control |
| Democrats: | 65 yrs |
| Republicans: | 35 yrs |
Senate and House Control by Party Past 100 Years
The following statistics reflect the years each political party has control a majority in both the Senate and House of Representatives concurrently over the past 100 years (1916–2015).
| Party | Years in Control |
| Democrats: | 57 yrs |
| Republicans: | 27 yrs |
| Neither Party: | 16 yrs |
Full Congress and White House Control by Party Past 100 Years
The following statistics reflect the years each political party has controlled a majority across both the Senate and House of Representatives and White House concurrently over the past 100 years (1916–2015).
| Party | Years in Control |
| Democrats: | 35 yrs |
| Republicans: | 16 yrs |
| Neither Party: | 49 yrs |
Party Control of White House
| Party | Years in Control |
| Democrats: | 52 yrs |
| Republicans: | 48 yrs |
See also
- List of political parties in the United States
- Divided government in the United States
- Party divisions of United States Congresses
- Political party strength in U.S. states
References
- ^ a b "Party In Power - Congress and Presidency - A Visual Guide To The Balance of Power In Congress, 1945-2008". Uspolitics.about.com. Retrieved 2012-09-17.
- ^ a b "Chart of Presidents of the United States". Filibustercartoons.com. Retrieved 2012-09-17.
- ^ a b "Composition of Congress by Party 1855–2013 —". Infoplease.com. Retrieved 2012-09-17.
