
Saint-Légier-La Chiésaz
Saint-Légier-La Chiésaz | |
|---|---|
 Saint-Légier and La Chiésaz villages | |
 Flag  Coat of arms | |
Location of Saint-Légier-La Chiésaz  | |
 Saint-Légier-La Chiésaz  Saint-Légier-La Chiésaz | |
| Coordinates: 46°28′N 06°53′E / 46.467°N 6.883°E | |
| Country | Switzerland |
| Canton | Vaud |
| District | Riviera-Pays-d'Enhaut |
| Government | |
| • Mayor | Syndic Alain Bovay |
| Area | |
| • Total | 15.12 km2 (5.84 sq mi) |
| Elevation | 567 m (1,860 ft) |
| Population (31 December 2018)[2] | |
| • Total | 5,184 |
| • Density | 340/km2 (890/sq mi) |
| Demonym(s) | Les Saint-Légerins Lè Tyalo |
| Time zone | UTC+01:00 (Central European Time) |
| • Summer (DST) | UTC+02:00 (Central European Summer Time) |
| Postal code(s) | 1806 |
| SFOS number | 5888 |
| ISO 3166 code | CH-VD |
| Localities | Clies, Hauteville (Vevey), La Chiésaz |
| Surrounded by | Châtel-Saint-Denis (FR), Blonay, La Tour-de-Peilz, Vevey, Corsier-sur-Vevey |
| Website | www Profile (in French), SFSO statistics |
Saint-Légier-La Chiésaz is a former municipality in the district of Riviera-Pays-d'Enhaut in the canton of Vaud in Switzerland. On 1 January 2022 the former municipalities of Blonay and Saint-Légier-La Chiésaz merged into the new municipality of Blonay - Saint-Légier.
History[edit]
Saint-Légier-La Chiésaz is first mentioned in 1228 as Sanctus Leodegarus.[3]
Geography[edit]


Saint-Légier-La Chiésaz has an area, as of 2009[update], of 15.2 square kilometers (5.9 sq mi). Of this area, 5.16 km2 (1.99 sq mi) or 34.0% is used for agricultural purposes, while 6.88 km2 (2.66 sq mi) or 45.4% is forested. Of the rest of the land, 2.93 km2 (1.13 sq mi) or 19.3% is settled (buildings or roads), 0.13 km2 (32 acres) or 0.9% is either rivers or lakes and 0.14 km2 (35 acres) or 0.9% is unproductive land.[4]
Of the built up area, industrial buildings made up 7.8% of the total area while housing and buildings made up 48.7% and transportation infrastructure made up 34.2%. Out of the forested land, 96.7% of the land area is heavily forested and 3.3% is covered with orchards or small clusters of trees. Of the agricultural land, 25.6% is used for growing crops and 45.9% is pastures, while 4.4% is used for orchards or vine crops and 24.4% is used for alpine pastures. All the water in the municipality is flowing water.[4]
The municipality was part of the Vevey District until it was dissolved on 31 August 2006, and Saint-Légier-La Chiésaz became part of the new district of Riviera-Pays-d'Enhaut.[5]
It consists of the villages of Saint-Légier and La Chiésaz along with a number of hamlets.
Coat of arms[edit]
The blazon of the municipal coat of arms is Gules, a Cross bottony Vert fimbrated Or.[6]
Demographics[edit]


Saint-Légier-La Chiésaz has a population (as of December 2020[update]) of 5,521.[7] As of 2008[update], 20.3% of the population are resident foreign nationals.[8] Over the last 10 years (1999–2009 ) the population has changed at a rate of 24.7%. It has changed at a rate of 22.3% due to migration and at a rate of 2.9% due to births and deaths.[9]
Most of the population (as of 2000[update]) speaks French (3,377 or 83.0%) as their first language, with German being second most common (383 or 9.4%) and English being third (119 or 2.9%). There are 60 people who speak Italian and 1 person who speaks Romansh.[10]
The age distribution of the population (as of 2000[update]) is children and teenagers (0–19 years old) make up 25.2% of the population, while adults (20–64 years old) make up 61.5% and seniors (over 64 years old) make up 13.3%.[9]
As of 2000[update], there were 1,674 people who were single and never married in the municipality. There were 2,013 married individuals, 188 widows or widowers and 193 individuals who are divorced.[10]
As of 2000[update], there were 1,523 private households in the municipality, and an average of 2.5 persons per household.[9] There were 393 households that consist of only one person and 116 households with five or more people. Out of a total of 1,562 households that answered this question, 25.2% were households made up of just one person and there were 8 adults who lived with their parents. Of the rest of the households, there are 469 married couples without children, 547 married couples with children There were 81 single parents with a child or children. There were 25 households that were made up of unrelated people and 39 households that were made up of some sort of institution or another collective housing.[10]
In 2000[update] there were 744 single family homes (or 70.1% of the total) out of a total of 1,061 inhabited buildings. There were 194 multi-family buildings (18.3%), along with 80 multi-purpose buildings that were mostly used for housing (7.5%) and 43 other use buildings (commercial or industrial) that also had some housing (4.1%).[11]
In 2000[update], a total of 1,488 apartments (85.9% of the total) were permanently occupied, while 196 apartments (11.3%) were seasonally occupied and 48 apartments (2.8%) were empty.[11] As of 2009[update], the construction rate of new housing units was 2.4 new units per 1000 residents.[9] The vacancy rate for the municipality, in 2010[update], was 0.15%.[9]
The historical population is given in the following chart:[3][12]

Heritage sites of national significance[edit]
Hauteville Castle and the Swiss Reformed Church of Notre-Dame are listed as Swiss heritage site of national significance.[13]
-
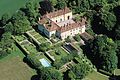 Hauteville Castle
 -
 Outbuildings of Hauteville Castle
 -
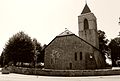 Swiss Reformed Church


Politics[edit]
In the 2007 federal election the most popular party was the SVP which received 19.02% of the vote. The next three most popular parties were the SP (16.96%), the LPS Party (15.73%) and the FDP (15.67%). In the federal election, a total of 1,447 votes were cast, and the voter turnout was 51.3%.[14]
Economy[edit]
As of 2010[update], Saint-Légier-La Chiésaz had an unemployment rate of 2.9%. As of 2008[update], there were 37 people employed in the primary economic sector and about 15 businesses involved in this sector. 353 people were employed in the secondary sector and there were 34 businesses in this sector. 1,253 people were employed in the tertiary sector, with 152 businesses in this sector.[9] There were 1,937 residents of the municipality who were employed in some capacity, of which females made up 43.4% of the workforce.
In 2008[update] the total number of full-time equivalent jobs was 1,411. The number of jobs in the primary sector was 32, of which 24 were in agriculture and 7 were in forestry or lumber production. The number of jobs in the secondary sector was 337 of which 124 or (36.8%) were in manufacturing and 178 (52.8%) were in construction. The number of jobs in the tertiary sector was 1,042. In the tertiary sector; 394 or 37.8% were in wholesale or retail sales or the repair of motor vehicles, 49 or 4.7% were in the movement and storage of goods, 31 or 3.0% were in a hotel or restaurant, 23 or 2.2% were in the information industry, 4 or 0.4% were the insurance or financial industry, 64 or 6.1% were technical professionals or scientists, 69 or 6.6% were in education and 314 or 30.1% were in health care.[15]
In 2000[update], there were 1,032 workers who commuted into the municipality and 1,513 workers who commuted away. The municipality is a net exporter of workers, with about 1.5 workers leaving the municipality for every one entering. About 1.6% of the workforce coming into Saint-Légier-La Chiésaz are coming from outside Switzerland.[16] Of the working population, 13.4% used public transportation to get to work, and 67.8% used a private car.[9]
Religion[edit]
From the 2000 census[update], 1,374 or 33.8% were Roman Catholic, while 1,769 or 43.5% belonged to the Swiss Reformed Church. Of the rest of the population, there were 18 members of an Orthodox church (or about 0.44% of the population), there were 4 individuals (or about 0.10% of the population) who belonged to the Christian Catholic Church, and there were 375 individuals (or about 9.22% of the population) who belonged to another Christian church. There were 7 individuals (or about 0.17% of the population) who were Jewish, and 15 (or about 0.37% of the population) who were Islamic. There were 2 individuals who were Buddhist and 3 individuals who belonged to another church. 533 (or about 13.10% of the population) belonged to no church, are agnostic or atheist, and 147 individuals (or about 3.61% of the population) did not answer the question.[10]
Education[edit]
In Saint-Légier-La Chiésaz about 1,540 or (37.9%) of the population have completed non-mandatory upper secondary education, and 909 or (22.3%) have completed additional higher education (either university or a Fachhochschule). Of the 909 who completed tertiary schooling, 51.7% were Swiss men, 26.2% were Swiss women, 12.7% were non-Swiss men and 9.5% were non-Swiss women.[10]
As of 2000[update], there were 59 students in Saint-Légier-La Chiésaz who came from another municipality, while 410 residents attended schools outside the municipality.[16]
References[edit]
- ^ a b "Arealstatistik Standard - Gemeinden nach 4 Hauptbereichen". Federal Statistical Office. Retrieved 13 January 2019.
- ^ "Ständige Wohnbevölkerung nach Staatsangehörigkeitskategorie Geschlecht und Gemeinde; Provisorische Jahresergebnisse; 2018". Federal Statistical Office. 9 April 2019. Retrieved 11 April 2019.
- ^ a b Saint-Légier-La Chiésaz in German, French and Italian in the online Historical Dictionary of Switzerland.
- ^ a b Swiss Federal Statistical Office-Land Use Statistics 2009 data (in German) accessed 25 March 2010
- ^ Nomenklaturen – Amtliches Gemeindeverzeichnis der Schweiz Archived 2015-11-13 at the Wayback Machine (in German) accessed 4 April 2011
- ^ Flags of the World.com accessed 18-August-2011
- ^ "Ständige und nichtständige Wohnbevölkerung nach institutionellen Gliederungen, Geburtsort und Staatsangehörigkeit". bfs.admin.ch (in German). Swiss Federal Statistical Office - STAT-TAB. 31 December 2020. Retrieved 21 September 2021.
- ^ Swiss Federal Statistical Office - Superweb database - Gemeinde Statistics 1981-2008 (in German) accessed 19 June 2010
- ^ a b c d e f g Swiss Federal Statistical Office accessed 18-August-2011
- ^ a b c d e STAT-TAB Datenwürfel für Thema 40.3 - 2000 Archived 2014-04-09 at the Wayback Machine (in German) accessed 2 February 2011
- ^ a b Swiss Federal Statistical Office STAT-TAB - Datenwürfel für Thema 09.2 - Gebäude und Wohnungen Archived 2014-09-07 at the Wayback Machine (in German) accessed 28 January 2011
- ^ Swiss Federal Statistical Office STAT-TAB Bevölkerungsentwicklung nach Region, 1850-2000 Archived 2014-09-30 at the Wayback Machine (in German) accessed 29 January 2011
- ^ "Kantonsliste A-Objekte". KGS Inventar (in German). Federal Office of Civil Protection. 2009. Archived from the original on 28 June 2010. Retrieved 25 April 2011.
- ^ Swiss Federal Statistical Office, Nationalratswahlen 2007: Stärke der Parteien und Wahlbeteiligung, nach Gemeinden/Bezirk/Canton (in German) accessed 28 May 2010
- ^ Swiss Federal Statistical Office STAT-TAB Betriebszählung: Arbeitsstätten nach Gemeinde und NOGA 2008 (Abschnitte), Sektoren 1-3 Archived 2014-12-25 at the Wayback Machine (in German) accessed 28 January 2011
- ^ a b Swiss Federal Statistical Office - Statweb Archived 2012-08-04 at archive.today (in German) accessed 24 June 2010
| International | |
|---|---|
| Geographic | |
| Other | |