2018 Trentino-Alto Adige/Südtirol provincial elections
The Trentino-Alto Adige/Südtirol provincial elections of 2018 took place on 21 October 2018.[1]
Trentino
| |||||||||||||||||||||||||||||||||||||||||
All 35 seats to the Provincial council of Trentino | |||||||||||||||||||||||||||||||||||||||||
|---|---|---|---|---|---|---|---|---|---|---|---|---|---|---|---|---|---|---|---|---|---|---|---|---|---|---|---|---|---|---|---|---|---|---|---|---|---|---|---|---|---|
| |||||||||||||||||||||||||||||||||||||||||
| |||||||||||||||||||||||||||||||||||||||||
In Trentino, the president is elected directly by the people; the candidate who gains the most votes is elected president.
 |
|---|
|
Parties and candidates
| Political party or alliance | Constituent lists | Previous result | Candidate | ||||
|---|---|---|---|---|---|---|---|
| Votes (%) | Seats | ||||||
| Centre-left coalition | Democratic Party (PD) | 22.1 | 9 | Giorgio Tonini
| |||
| Union for Trentino (UpT) | 13.3 | 5 | |||||
| Futura 2018 (incl. FdV) | — | — | |||||
| Centre-right coalition | Trentino Project (PT) | 9.0 | 4 | Maurizio Fugatti
| |||
| League Trentino (LT) | 6.2 | 1 | |||||
| Forza Italia (FI) | 4.4 | – | |||||
| Trentino Civic List (CT) | 3.7 | 1 | |||||
| Brothers of Italy (FdI) | 1.6 | – | |||||
| Fassa Association (Fassa) | 0.8 | – | |||||
| Popular Autonomists (AP) | — | — | |||||
| Act for Trentino | — | — | |||||
| Union of the Centre – People's Centre (UDC–CP) | — | — | |||||
| Trentino Tyrolean Autonomist Party (PATT) | 17.6 | 7 | Ugo Rossi
| ||||
| Five Star Movement (M5S) | 5.9 | 1 | Filippo Degasperi
| ||||
| Left wing coalition | Free and Equal (LeU) (incl. Art.1 and SI) | 1.8 | – | Antonella Valer
| |||
| The Other Trentino on the Left (incl. PRC and PaP) | 1.2 | – | |||||
Results
 | |||||||||
| Candidates | Votes | % | Seats | Parties | Votes | % | Seats | ||
|---|---|---|---|---|---|---|---|---|---|
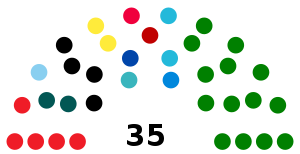
| Maurizio Fugatti | 124,590 | 46.74 | 1 | ||||||
| League | 69,116 | 27.09 | 13 | ||||||
| Trentino Civic List | 11,777 | 4.62 | 2 | ||||||
| Trentino Project | 8,248 | 3.23 | 1 | ||||||
| Popular Autonomists | 7,621 | 2.99 | 1 | ||||||
| Forza Italia | 7,204 | 2.82 | 1 | ||||||
| Act for Trentino | 5,458 | 2.14 | 1 | ||||||
| Union of the Centre – People's Centre | 5,306 | 2.08 | – | ||||||
| Brothers of Italy | 3,686 | 1.44 | – | ||||||
| Fassa Association | 2,490 | 0.98 | 1 | ||||||
| Total | 120,906 | 47.39 | 20 | ||||||
| Giorgio Tonini | 67,712 | 25.40 | 1 | ||||||
| Democratic Party | 35,530 | 13.93 | 4 | ||||||
| Futura 2018 | 17,670 | 6.93 | 2 | ||||||
| Union for Trentino | 10,150 | 3.98 | 1 | ||||||
| Total | 63,350 | 24.83 | 7 | ||||||
| Ugo Rossi | 33,121 | 12.42 | 1 | Trentino Tyrolean Autonomist Party | 32,109 | 12.59 | 3 | ||
| Filippo Degasperi | 18,922 | 7.10 | 1 | Five Star Movement | 18,437 | 7.23 | 1 | ||
| Antonella Valer | 7,099 | 2.66 | – | ||||||
| Free and Equal | 3,560 | 1.40 | – | ||||||
| The Other Trentino on the Left | 2,101 | 0.82 | – | ||||||
| Total | 5,661 | 2.22 | – | ||||||
| Mauro Ottobre | 5,237 | 1.96 | – | Dynamic Autonomy | 5,117 | 2.01 | – | ||
| Roberto de Laurentis | 4,015 | 1.51 | – | Territoriality Responsibility Economics | 3,826 | 1.50 | – | ||
| Paolo Primon | 2,384 | 0.89 | – | Free People | 2,285 | 0.90 | – | ||
| Ferruccio Chenetti | 1,904 | 0.71 | – | Movement Ladin Fassa | 1,890 | 0.74 | – | ||
| Filippo Castaldini | 1,247 | 0.47 | – | CasaPound | 1,215 | 0.48 | – | ||
| Federico Monegaglia | 350 | 0.13 | – | Reconquer Italy | 341 | 0.13 | – | ||
| Total candidates | 266,581 | 100 | 4 | Total parties | 255,137 | 100 | 31 | ||
| Source: Autonomous Province of Trento | |||||||||
Analysis
Similar to the election in Molise and the election in Friuli-Venezia Giulia, the M5S lost c. 15% of votes compared to the general election. On March 4, they reached almost 25%,[3] but now just over 7%. By contrast, the centre-right coalition gained more than 10% compared to March 4.[3]
South Tyrol
| |||||||||||||||||||||||||||||
All 35 seats to the Landtag of South Tyrol | |||||||||||||||||||||||||||||
|---|---|---|---|---|---|---|---|---|---|---|---|---|---|---|---|---|---|---|---|---|---|---|---|---|---|---|---|---|---|
| |||||||||||||||||||||||||||||
| |||||||||||||||||||||||||||||
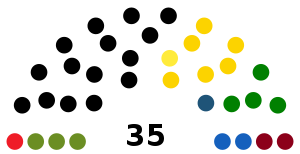
In South Tyrol, all 35 members of the Provincial council (Landtag) are up for re-election. The council elects a government headed by a president (Landeshauptmann).
In the 2013 election, the South Tyrolean People's Party (SVP) lost its absolute majority for the first time since 1948.
Results
 | ||||||
| Parties | Votes | % | Seats | +/− | ||
|---|---|---|---|---|---|---|
| South Tyrolean People's Party | 119,109 | 41.9 | 15 | −2 | ||
| Team Köllensperger | 43,315 | 15.2 | 6 | +6 | ||
| League | 31,515 | 11.1 | 4 | +4 | ||
| Greens | 19,392 | 6.8 | 3 | ±0 | ||
| Die Freiheitlichen | 17,620 | 6.2 | 2 | −4 | ||
| South Tyrolean Freedom | 16,927 | 6.0 | 2 | −1 | ||
| Democratic Party | 10,808 | 3.8 | 1 | −1 | ||
| Five Star Movement | 6,670 | 2.4 | 1 | ±0 | ||
| Alto Adige in the Heart – Brothers of Italy | 4,882 | 1.7 | 1 | ±0 | ||
| Citizens' Union | 3,665 | 1.3 | 0 | −1 | ||
| We South Tyrol | 3,428 | 1.2 | 0 | ±0 | ||
| Forza Alto Adige | 2,826 | 1.0 | 0 | ±0 | ||
| CasaPound | 2,451 | 0.9 | 0 | ±0 | ||
| United Left | 1,753 | 0.6 | 0 | ±0 | ||
| Total | 284,361 | 100.0 | 35 | ±0 | ||
| Source: Province of Bolzano – Results | ||||||
References
- ^ Provinciali Bolzano e Trento 21 ottobre, Ansa, 8 May 2018. Retrieved 14 May 2018.
- ^ The swing comes from the combined result of the coalition of Diego Mosna (19.3%), the coalition of Lega Nord (6.6%), Forza Italia (4.3%), FdI (1.5%) and Fassa (0.8%) in the 2013 provincial election.
- ^ a b Collegio Plurinominale TRENTINO-ALTO ADIGE/SÜDTIROL - 01


