
File:COVID-19 outbreak USA per capita cases map.svg

Size of this PNG preview of this SVG file: 800 × 495 pixels. Other resolutions: 320 × 198 pixels | 640 × 396 pixels | 1,024 × 633 pixels | 1,280 × 791 pixels | 2,560 × 1,583 pixels | 959 × 593 pixels.
Original file (SVG file, nominally 959 × 593 pixels, file size: 44 KB)
| This is a file from the Wikimedia Commons. Information from its description page there is shown below. Commons is a freely licensed media file repository. You can help. |
Summary
| Description |
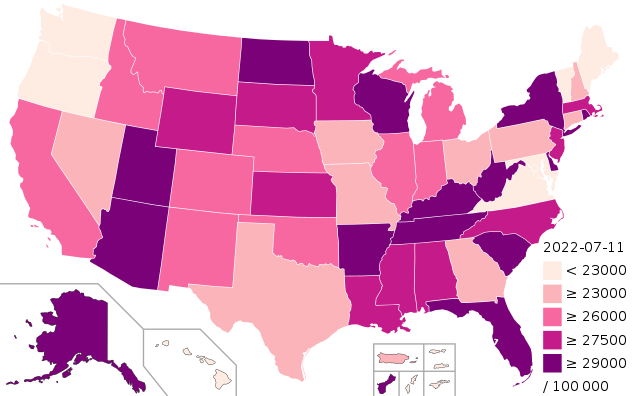
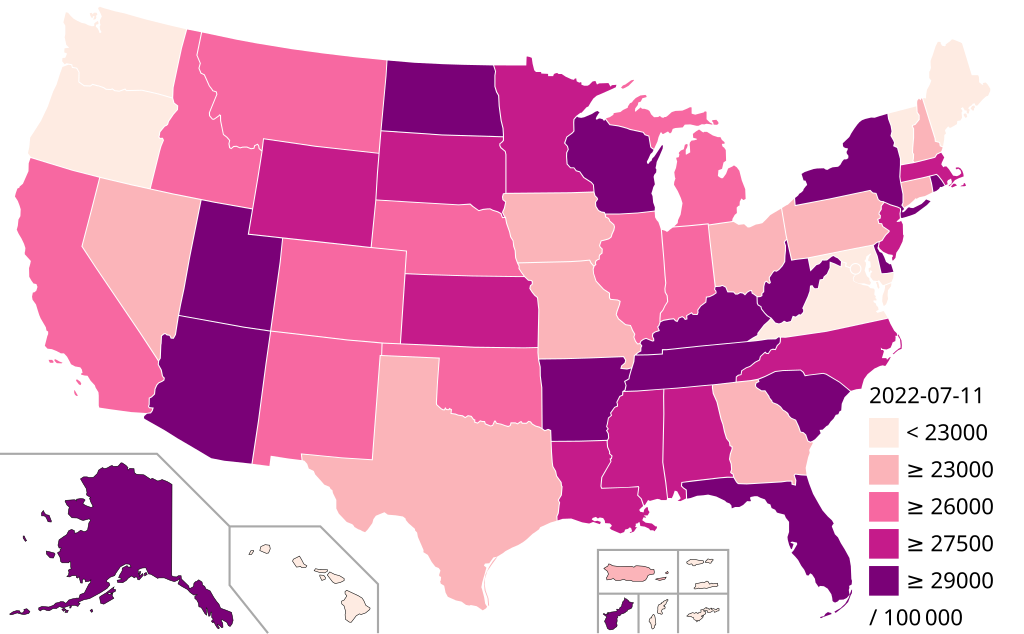
English: Confirmed cases of COVID-19 per 100,000 residents in the USA by state or territory
|
| Date | |
| Source |
Own work; created using Python script This vector image includes elements that have been taken or adapted from this file: |
| Author | Ythlev |
| SVG development |
Licensing
I, the copyright holder of this work, hereby publish it under the following license:
This file is licensed under the Creative Commons Attribution-Share Alike 4.0 International license.
- You are free:
- to share – to copy, distribute and transmit the work
- to remix – to adapt the work
- Under the following conditions:
- attribution – You must give appropriate credit, provide a link to the license, and indicate if changes were made. You may do so in any reasonable manner, but not in any way that suggests the licensor endorses you or your use.
- share alike – If you remix, transform, or build upon the material, you must distribute your contributions under the same or compatible license as the original.
File history
Click on a date/time to view the file as it appeared at that time.
| Date/Time | Thumbnail | Dimensions | User | Comment | |
|---|---|---|---|---|---|
| current | 03:13, 12 July 2022 | | 959 × 593 (44 KB) | TheNavigatrr | Updated scale and states for July 11. |
| 01:26, 9 July 2022 |  | 959 × 593 (44 KB) | TheNavigatrr | Updated scale and states for July 7. | |
| 23:41, 6 May 2022 |  | 959 × 593 (44 KB) | TheNavigatrr | corrected date. | |
| 23:39, 6 May 2022 |  | 959 × 593 (44 KB) | TheNavigatrr | Updated scale and states for May 5. | |
| 04:01, 27 March 2022 |  | 959 × 593 (44 KB) | TheNavigatrr | Updated scale and states for March 26. | |
| 05:17, 13 March 2022 |  | 959 × 593 (44 KB) | TheNavigatrr | Updates states for March 12. | |
| 05:04, 11 March 2022 |  | 959 × 593 (44 KB) | TheNavigatrr | Updated scale and states for March 10. | |
| 04:12, 2 March 2022 |  | 959 × 593 (44 KB) | TheNavigatrr | Updated states for March 1. | |
| 04:20, 20 February 2022 |  | 959 × 593 (44 KB) | TheNavigatrr | Updated scale and states for February 19. | |
| 04:34, 16 February 2022 |  | 959 × 593 (44 KB) | TheNavigatrr | Updated scale and states for February 15. | |
| 04:48, 13 February 2022 |  | 959 × 593 (44 KB) | TheNavigatrr | Updated scale and states for February 12. | |
| 13:44, 9 February 2022 |  | 959 × 593 (44 KB) | TheNavigatrr | Updated scale and states for February 8. | |
| 15:53, 5 February 2022 |  | 959 × 593 (44 KB) | TheNavigatrr | Updated scale and states for February 4. | |
| 04:47, 2 February 2022 |  | 959 × 593 (44 KB) | TheNavigatrr | Updated scale and states for February 1. | |
| 05:58, 29 January 2022 |  | 959 × 593 (44 KB) | TheNavigatrr | Updated scale and states for January 28. | |
| 06:40, 27 January 2022 |  | 959 × 593 (44 KB) | TheNavigatrr | Updated scale and states for January 26. | |
| 04:54, 26 January 2022 |  | 959 × 593 (44 KB) | TheNavigatrr | Updated scale and states for January 25. | |
| 05:08, 24 January 2022 |  | 959 × 593 (44 KB) | TheNavigatrr | Updated scale and states for January 23. | |
| 03:33, 18 January 2022 |  | 959 × 593 (44 KB) | TheNavigatrr | Updated states for January 17. | |
| 06:12, 16 January 2022 |  | 959 × 593 (44 KB) | TheNavigatrr | Updated scale and states for January 15. | |
| 06:03, 6 January 2022 |  | 959 × 593 (44 KB) | TheNavigatrr | Updated scale and states for December 27. | |
| 17:23, 28 December 2021 |  | 959 × 593 (44 KB) | TheNavigatrr | Updated scale and states for December 27. | |
| 14:16, 11 December 2021 |  | 959 × 593 (44 KB) | TheNavigatrr | Updated scale and states data for December 10 | |
| 02:27, 20 November 2021 |  | 959 × 593 (44 KB) | TheNavigatrr | Updated all states to new scale and latest data. Accurate as of 11-19. | |
| 16:12, 18 October 2021 |  | 959 × 593 (44 KB) | TheNavigatrr | Updated West Virginia. Accurate as of 10-17. | |
| 02:35, 16 October 2021 |  | 959 × 593 (44 KB) | TheNavigatrr | Updated Kansas. Accurate as of 10-15. | |
| 03:18, 15 October 2021 |  | 959 × 593 (44 KB) | TheNavigatrr | Accurate as of 10-14 | |
| 17:58, 4 October 2021 |  | 959 × 593 (44 KB) | TheNavigatrr | Accurate as of October 3 | |
| 03:48, 26 September 2021 |  | 959 × 593 (44 KB) | TheNavigatrr | Updated scale and states, accurate as of September 25 | |
| 01:23, 11 September 2021 |  | 959 × 593 (44 KB) | TheNavigatrr | Updated North Carolina/Utah and made a slight update to the scale | |
| 15:52, 4 September 2021 |  | 959 × 593 (44 KB) | TheNavigatrr | Updated Montana and made a slight update to the scale, as many more states will soon pass 14/100 cases. | |
| 15:21, 2 September 2021 |  | 959 × 593 (44 KB) | TheNavigatrr | Updated scale again, accurate as of 09-01. | |
| 16:49, 27 August 2021 |  | 959 × 593 (44 KB) | TheNavigatrr | Forgot to upload. Updated several states and adjusted scale again, as this is a fast-growing wave. Accurate as of 08-26. | |
| 15:10, 24 August 2021 |  | 959 × 593 (44 KB) | TheNavigatrr | Updated several states and adjusted the scale significantly to account for the rapid rise in cases in several states. Accurate as of 08-23. | |
| 01:57, 17 August 2021 |  | 959 × 593 (44 KB) | TheNavigatrr | Updated Kansas, Louisiana, and New Mexico. Accurate as of 08-16. | |
| 01:43, 16 August 2021 |  | 959 × 593 (44 KB) | TheNavigatrr | The previous map was inaccurate! North Carolina was 10558 cases per 100,000 people as of August 14. | |
| 03:00, 15 August 2021 |  | 959 × 593 (44 KB) | TheNavigatrr | Adjusted scale and updated states. Accurate as of 08-14. | |
| 14:38, 11 August 2021 |  | 959 × 593 (44 KB) | TheNavigatrr | Updated Idaho and changed scale to show the difference in infection rate between Arkansas/Tennessee and neighboring states. Accurate as of 08-10. | |
| 00:19, 10 August 2021 |  | 959 × 593 (44 KB) | TheNavigatrr | Updated Georgia, New Hampshire, and Wyoming. Accurate as of 08-09. | |
| 18:45, 9 August 2021 |  | 959 × 593 (44 KB) | TheNavigatrr | Accurate as of 08-07. Updated Missouri. | |
| 16:54, 6 August 2021 |  | 959 × 593 (44 KB) | TheNavigatrr | Accurate as of 08-05. Updated Massachusetts, Delaware, Kansas, and Alaska. | |
| 16:19, 3 August 2021 |  | 959 × 593 (44 KB) | TheNavigatrr | Accurate as of 08-02 | |
| 15:30, 30 July 2021 |  | 959 × 593 (44 KB) | TheNavigatrr | Updated several states and adjusted the scale slightly. Accurate as of 07-29 | |
| 23:02, 25 July 2021 |  | 959 × 593 (44 KB) | TheNavigatrr | Updated Alabama, Alaska, and Florida. Accurate as of 07-25. | |
| 20:09, 20 July 2021 |  | 959 × 593 (44 KB) | TheNavigatrr | Updated scale and states for July 20 | |
| 03:06, 23 May 2021 |  | 959 × 593 (44 KB) | TheNavigatrr | Updated scale and states for May 22 | |
| 04:58, 10 May 2021 |  | 959 × 593 (44 KB) | TheNavigatrr | Forgot to upload. Updated Alaska. Accurate as of 05-08. | |
| 21:24, 3 May 2021 |  | 959 × 593 (44 KB) | TheNavigatrr | Michigan quickly passed this 9400/100,000 threshold due to its rising case count. Accurate as of its date, which is May 1. | |
| 21:20, 3 May 2021 |  | 959 × 593 (44 KB) | TheNavigatrr | Updated scale to reflect the relative closeness of North Carolina, Ohio, Pennsylvania, and Colorado in per capita case counts. Accurate as of its date, which is April 30. | |
| 04:02, 26 April 2021 |  | 959 × 593 (44 KB) | TheNavigatrr | Updated Michigan. | |
| 16:13, 21 April 2021 |  | 959 × 593 (44 KB) | TheNavigatrr | Updated North Carolina for 04-19. Accurate as of 04-21. | |
| 18:54, 18 April 2021 |  | 959 × 593 (44 KB) | TheNavigatrr | Updated New Jersey. Accurate as of 04-18. | |
| 03:34, 18 April 2021 |  | 959 × 593 (44 KB) | TheNavigatrr | Updated Ohio. Accurate as of 04-17. | |
| 03:29, 18 April 2021 |  | 959 × 593 (44 KB) | TheNavigatrr | Updated South Carolina. Accurate as of 04-16. | |
| 03:27, 13 April 2021 |  | 959 × 593 (44 KB) | TheNavigatrr | Adjusted scale and updated states. Accurate as of 04-12. | |
| 16:15, 8 April 2021 |  | 959 × 593 (44 KB) | TheNavigatrr | Updated New Jersey. Accurate as of 04-07. | |
| 04:06, 1 April 2021 |  | 959 × 593 (44 KB) | TheNavigatrr | Updated Alabama. Accurate as of 03-31. | |
| 04:19, 29 March 2021 |  | 959 × 593 (44 KB) | TheNavigatrr | Adjusted scale while barely changing states. This scale more accurately reflects the natural grouping of states, since the difference between 9700 (Montana, Illinois) and 10100/person (Idaho, Indiana) is insignificant compared to the difference between both and 11,000/person (Iowa, Oklahoma). | |
| 02:57, 27 March 2021 |  | 959 × 593 (44 KB) | TheNavigatrr | Updated New Hampshire and Idaho. Accurate as of 03-26. | |
| 15:54, 17 March 2021 |  | 959 × 593 (44 KB) | TheNavigatrr | Updated Indiana. Accurate as of 03-17. | |
| 05:34, 14 March 2021 |  | 959 × 593 (44 KB) | TheNavigatrr | Slightly adjusted scale. States affected were New Hampshire and Rhode Island. Accurate as of 03-13. | |
| 04:22, 8 March 2021 |  | 959 × 593 (44 KB) | TheNavigatrr | Updated Mississippi. Accurate as of 03-07. | |
| 18:01, 7 March 2021 |  | 959 × 593 (44 KB) | TheNavigatrr | Slightly adjusted scale. Accurate as of 03-06. | |
| 04:16, 28 February 2021 |  | 959 × 593 (44 KB) | TheNavigatrr | Updated South Carolina. Accurate as of 02-27. | |
| 04:08, 27 February 2021 |  | 959 × 593 (44 KB) | TheNavigatrr | Updated Alabama. Accurate as of 02-26. | |
| 03:12, 21 February 2021 |  | 959 × 593 (44 KB) | TheNavigatrr | Updated scale to increments of 2500: 5000, 7500, 10000, and 12500. This shows the difference between New Hampshire and its neighbors, as well as the severity of North and South Dakota's outbreaks. | |
| 04:57, 20 February 2021 |  | 959 × 593 (44 KB) | TheNavigatrr | Updated Kansas and New York. Accurate as of 02-19. | |
| 05:23, 14 February 2021 |  | 959 × 593 (44 KB) | TheNavigatrr | Accurate as of 02-13. | |
| 19:15, 7 February 2021 |  | 959 × 593 (44 KB) | TheNavigatrr | Updated Maryland, which crossed 6,000 today. Accurate as of 02-07. | |
| 18:47, 7 February 2021 |  | 959 × 593 (44 KB) | TheNavigatrr | Updated for yesterday's data | |
| 18:42, 7 February 2021 |  | 959 × 593 (44 KB) | TheNavigatrr | Updated scale and adjusted states accordingly | |
| 19:25, 6 February 2021 |  | 959 × 593 (44 KB) | TheNavigatrr | Updated for Feb 5. | |
| 05:29, 3 February 2021 |  | 959 × 593 (44 KB) | TheNavigatrr | Updated Nevada and Wyoming. Accurate as of 02-02. | |
| 08:48, 30 January 2021 |  | 959 × 593 (44 KB) | TheNavigatrr | Updated Connecticut. Accurate as of 01-29. | |
| 15:16, 29 January 2021 |  | 959 × 593 (44 KB) | TheNavigatrr | Updated North Carolina. Accurate as of 01-28. | |
| 05:50, 28 January 2021 |  | 959 × 593 (44 KB) | TheNavigatrr | Updated New York, Mississippi, Idaho. Accurate as of 01-27. | |
| 17:21, 26 January 2021 |  | 959 × 593 (44 KB) | TheNavigatrr | Updated Alabama. Accurate as of 01-25. | |
| 04:27, 25 January 2021 |  | 959 × 593 (44 KB) | TheNavigatrr | Updated Indiana. Accurate as of 01-23. | |
| 04:59, 22 January 2021 |  | 959 × 593 (44 KB) | TheNavigatrr | Updated Massachusetts. Accurate as of 01-21. | |
| 05:40, 20 January 2021 |  | 959 × 593 (44 KB) | TheNavigatrr | 01-19 update. | |
| 19:31, 19 January 2021 |  | 959 × 593 (44 KB) | TheNavigatrr | Adjusted yesterday's data to a different scale, which avoids the excess of states at >8500 and is more balanced. | |
| 19:24, 19 January 2021 |  | 959 × 593 (44 KB) | TheNavigatrr | Updated file for 01-18. | |
| 08:44, 16 January 2021 |  | 959 × 593 (44 KB) | TheNavigatrr | Updated Alabama. Accurate as of 01-15. | |
| 18:02, 15 January 2021 |  | 959 × 593 (44 KB) | TheNavigatrr | Updated scale for the color scheme. Accurate as of 01-13 (and no changes since then) | |
| 06:17, 13 January 2021 |  | 959 × 593 (44 KB) | TheNavigatrr | Updated North Carolina and Connecticut. Accurate as of 01-12. | |
| 04:43, 11 January 2021 |  | 959 × 593 (44 KB) | TheNavigatrr | Updated New Jersey, Mississippi, Nevada. Accurate as of 01-10. | |
| 04:26, 9 January 2021 |  | 959 × 593 (44 KB) | TheNavigatrr | Updated several states. Accurate as of 01-08. | |
| 03:53, 8 January 2021 |  | 959 × 593 (44 KB) | TheNavigatrr | Updated Arizona. Accurate as of 01-07. | |
| 02:53, 7 January 2021 |  | 959 × 593 (44 KB) | TheNavigatrr | Updated Indiana and Arkansas. Accurate as of 01-06. | |
| 05:13, 6 January 2021 |  | 959 × 593 (44 KB) | TheNavigatrr | Updated Colorado. Accurate as of 01-05. | |
| 06:52, 5 January 2021 |  | 959 × 593 (44 KB) | TheNavigatrr | Updated Delaware, Idaho, and Kansas. Accurate as of 01-04. | |
| 06:50, 5 January 2021 |  | 959 × 593 (44 KB) | TheNavigatrr | Updating color scale for 01-03. | |
| 01:44, 4 January 2021 |  | 959 × 593 (44 KB) | TheNavigatrr | Updated Oklahoma and Nevada. Accurate as of 01-03. | |
| 00:26, 3 January 2021 |  | 959 × 593 (44 KB) | TheNavigatrr | Updated map for 01-02. | |
| 05:07, 2 January 2021 |  | 959 × 593 (44 KB) | TheNavigatrr | Updated Arkansas. Accurate as of 01-01. | |
| 05:27, 1 January 2021 |  | 959 × 593 (44 KB) | TheNavigatrr | Correction, New York is over 5,000/100,000. | |
| 05:25, 1 January 2021 |  | 959 × 593 (44 KB) | TheNavigatrr | Updated Pennsylvania. Accurate as of 12-31. | |
| 20:16, 31 December 2020 |  | 959 × 593 (44 KB) | TheNavigatrr | Updated for 12-30 data. | |
| 06:54, 30 December 2020 |  | 959 × 593 (44 KB) | TheNavigatrr | Updated Montana. Accurate as of 12-29 | |
| 17:36, 29 December 2020 |  | 959 × 593 (44 KB) | TheNavigatrr | Updated scale. Accurate as of 12-28 | |
| 04:00, 28 December 2020 |  | 959 × 593 (44 KB) | TheNavigatrr | Updated Minnesota. Accurate as of 12-27. | |
| 06:53, 27 December 2020 |  | 959 × 593 (44 KB) | TheNavigatrr | Updated Massachusetts as well as a slight alteration to the scale. Accurate as of 12-26. | |
| 08:40, 26 December 2020 |  | 959 × 593 (44 KB) | TheNavigatrr | Updated Arkansas. Accurate as of 12-25. | |
| 02:48, 24 December 2020 |  | 959 × 593 (44 KB) | TheNavigatrr | Updated California, New Jersey and Oregon. Accurate as of 12-23. | |
| 05:02, 23 December 2020 |  | 959 × 593 (44 KB) | TheNavigatrr | Updated Indiana. Accurate as of 12-22. | |
| 01:56, 22 December 2020 |  | 959 × 593 (44 KB) | TheNavigatrr | Updated Michigan. Accurate as of 12-21. | |
| 06:11, 21 December 2020 |  | 959 × 593 (44 KB) | TheNavigatrr | 12-20. | |
| 04:31, 20 December 2020 |  | 959 × 593 (44 KB) | TheNavigatrr | Updated Illinois and Kansas. Accurate as of 12-19. | |
| 03:36, 19 December 2020 |  | 959 × 593 (44 KB) | TheNavigatrr | Updated New Hampshire. Accurate as of 12-18. | |
| 04:50, 18 December 2020 |  | 959 × 593 (44 KB) | TheNavigatrr | Updated scale values and the states. Accurate as of 12-17. | |
| 05:16, 16 December 2020 |  | 959 × 593 (44 KB) | TheNavigatrr | Updated Pennsylvania. Accurate as of 12-16. | |
| 14:32, 15 December 2020 |  | 959 × 593 (44 KB) | TheNavigatrr | Updated New York, Alabama. Accurate as of 12-15. | |
| 03:18, 14 December 2020 |  | 959 × 593 (44 KB) | TheNavigatrr | Missed California. | |
| 03:09, 14 December 2020 |  | 959 × 593 (44 KB) | TheNavigatrr | Updated Nevada, Mississippi, and Oklahoma. Accurate as of 12-13. | |
| 02:56, 13 December 2020 |  | 959 × 593 (44 KB) | TheNavigatrr | Updated Wisconsin. Accurate as of 12-12. | |
| 06:33, 12 December 2020 |  | 959 × 593 (44 KB) | TheNavigatrr | Updated Massachusetts, Arkansas. Accurate as of 12-11. | |
| 18:42, 11 December 2020 |  | 959 × 593 (44 KB) | TheNavigatrr | Corrected yesterday's map for Iowa and Connecticut. | |
| 07:28, 11 December 2020 |  | 959 × 593 (44 KB) | TheNavigatrr | 12-10. | |
| 00:25, 10 December 2020 |  | 959 × 593 (44 KB) | TheNavigatrr | Updated New Hampshire. | |
| 00:20, 10 December 2020 |  | 959 × 593 (44 KB) | TheNavigatrr | Accurate as of 12-09. | |
| 00:19, 10 December 2020 |  | 959 × 593 (44 KB) | TheNavigatrr | New scale, accurate for yesterday | |
| 23:16, 7 December 2020 |  | 959 × 593 (44 KB) | TheNavigatrr | Updated Virginia. Accurate as of 12-07. | |
| 01:54, 7 December 2020 |  | 959 × 593 (44 KB) | TheNavigatrr | Updated Arizona and Alaska. | |
| 21:28, 6 December 2020 |  | 959 × 593 (44 KB) | TheNavigatrr | Updated Ohio and West Virginia. Accurate as of 12-06. | |
| 23:46, 5 December 2020 |  | 959 × 593 (44 KB) | TheNavigatrr | Updated Delaware. Accurate as of 12-05. | |
| 05:15, 5 December 2020 |  | 959 × 593 (44 KB) | TheNavigatrr | Updated Nebraska, which reported very late in the day. | |
| 00:50, 5 December 2020 |  | 959 × 593 (44 KB) | TheNavigatrr | Updated New Jersey and New Mexico. Accurate as of 12-04. | |
| 02:57, 4 December 2020 |  | 959 × 593 (44 KB) | TheNavigatrr | Updated Pennsylvania. Accurate as of 12-03. | |
| 23:37, 2 December 2020 |  | 959 × 593 (44 KB) | TheNavigatrr | Updated Michigan. Accurate as of 12-02. | |
| 23:46, 1 December 2020 |  | 959 × 593 (44 KB) | TheNavigatrr | Updated Missouri, Louisiana, and Nevada. Accurate as of 12-01. | |
| 02:20, 1 December 2020 |  | 959 × 593 (44 KB) | TheNavigatrr | Updated Indiana, Colorado, and Oklahoma. Accurate as of 11-30. | |
| 21:51, 29 November 2020 |  | 959 × 593 (44 KB) | TheNavigatrr | Updated Wisconsin, Alabama, Mississippi, and Washington D.C. Accurate as of 11-29. | |
| 22:21, 28 November 2020 |  | 959 × 593 (44 KB) | TheNavigatrr | Updated Mississippi. Accurate as of 11-28. | |
| 22:17, 28 November 2020 |  | 959 × 593 (44 KB) | TheNavigatrr | Re-uploading yesterday's map with a scale adjusted to show the difference between some states and others. This scale will continue. | |
| 01:05, 28 November 2020 |  | 959 × 593 (44 KB) | TheNavigatrr | Rhode Island. Accurate as of 11-27. | |
| 05:49, 27 November 2020 |  | 959 × 593 (44 KB) | TheNavigatrr | Updated Arkansas, Guam. Accurate as of 11-26. | |
| 02:02, 26 November 2020 |  | 959 × 593 (44 KB) | TheNavigatrr | Updated Washington, Kansas, and Alaska. Accurate as of 11-25. | |
| 04:01, 25 November 2020 |  | 959 × 593 (44 KB) | TheNavigatrr | Updated Minnesota, Connecticut. Accurate as of 11-24. | |
| 00:20, 24 November 2020 |  | 959 × 593 (44 KB) | TheNavigatrr | Updated Texas, Massachusetts, New Mexico, Nebraska, Tennessee. Accurate as of 11-23. | |
| 22:26, 22 November 2020 |  | 959 × 593 (44 KB) | TheNavigatrr | Updated Ohio, Maryland, and South Carolina. Accurate as of 11-22. | |
| 18:50, 21 November 2020 |  | 959 × 593 (44 KB) | TheNavigatrr | Updated Montana. Accurate as of 11-21. | |
| 03:14, 21 November 2020 |  | 959 × 593 (44 KB) | TheNavigatrr | Updated New York, Illinois, Arizona, and Idaho. Accurate as of 11-20. | |
| 21:46, 19 November 2020 |  | 959 × 593 (44 KB) | TheNavigatrr | Updated Indiana. Accurate as of 11-19. | |
| 01:43, 19 November 2020 |  | 959 × 593 (44 KB) | TheNavigatrr | Updated Colorado, Utah, and West Virginia. Accurate as of 11-18. | |
| 19:38, 17 November 2020 |  | 959 × 593 (44 KB) | TheNavigatrr | Updated North Carolina, Delaware, Oklahoma, and Nevada. Accurate as of 11-17. | |
| 06:48, 17 November 2020 |  | 959 × 593 (44 KB) | TheNavigatrr | Updated Wyoming. | |
| 21:06, 16 November 2020 |  | 959 × 593 (44 KB) | TheNavigatrr | Updated Minnesota and Missouri. Accurate as of 11-16. | |
| 20:57, 15 November 2020 |  | 959 × 593 (44 KB) | TheNavigatrr | Updated Georgia. Accurate as of 11-15. | |
| 20:21, 15 November 2020 |  | 959 × 593 (44 KB) | TheNavigatrr | Updated Nebraska, New Mexico and Kentucky for 11-14 map. | |
| 20:18, 15 November 2020 |  | 959 × 593 (44 KB) | TheNavigatrr | Correcting November 13 file, as Georgia and South Carolina were mismarked. | |
| 03:29, 14 November 2020 |  | 959 × 593 (44 KB) | TheNavigatrr | Updated scale to reflect the difference between the Dakotas/Wisconsin and neighboring states like Minnesota. Also updated Pennsylvania, Kansas, and Alaska which entered higher levels. Accurate as of 11-13. | |
| 19:57, 12 November 2020 |  | 959 × 593 (44 KB) | TheNavigatrr | Updated Montana, which reported later. | |
| 19:29, 12 November 2020 |  | 959 × 593 (44 KB) | TheNavigatrr | Updated Florida and New Jersey. Accurate as of 11-12. | |
| 21:02, 10 November 2020 |  | 959 × 593 (44 KB) | TheNavigatrr | Updated Illinois and Wyoming. Accurate as of 11-10. | |
| 03:32, 8 November 2020 |  | 959 × 593 (44 KB) | TheNavigatrr | Corrected Idaho, which updates late in the day. | |
| 22:45, 7 November 2020 |  | 959 × 593 (44 KB) | TheNavigatrr | Updated Arkansas, Utah. Accurate as of 11-07. | |
| 21:48, 6 November 2020 |  | 959 × 593 (44 KB) | TheNavigatrr | Updated Nebraska, Tennessee, Ohio, Guam. Accurate as of 11-06. | |
| 06:12, 5 November 2020 |  | 959 × 593 (44 KB) | TheNavigatrr | Updated Kansas. Accurate as of 11-04. | |
| 23:57, 3 November 2020 |  | 959 × 593 (44 KB) | TheNavigatrr | Updated for 11-03. | |
| 22:50, 2 November 2020 |  | 959 × 593 (44 KB) | TheNavigatrr | Updated Michigan, Connecticut. Accurate as of 11-02. | |
| 22:59, 1 November 2020 |  | 959 × 593 (44 KB) | TheNavigatrr | Updated Missouri. Accurate as of 11-01. | |
| 23:05, 31 October 2020 |  | 959 × 593 (44 KB) | TheNavigatrr | Updated Montana as well as the scale. Accurate as of 10-31. | |
| 21:34, 30 October 2020 |  | 959 × 593 (44 KB) | TheNavigatrr | Updated Nebraska, Utah. Accurate as of 10-30. | |
| 22:48, 29 October 2020 |  | 959 × 593 (44 KB) | TheNavigatrr | Updated Rhode Island, Wyoming, Idaho. Corrected Guam. Accurate as of 10-29. | |
| 05:00, 27 October 2020 |  | 959 × 593 (44 KB) | TheNavigatrr | Updated scale because too many states were over 3000/100,000. Updated Oklahoma, Wisconsin, Oregon. Accurate as of 10-26. | |
| 22:15, 24 October 2020 |  | 959 × 593 (44 KB) | TheNavigatrr | Updated Montana. Accurate as of 10-24. | |
| 22:26, 23 October 2020 |  | 959 × 593 (44 KB) | TheNavigatrr | Updated Virginia (over 2000) and Guam (over 2500). Updated scale back to the simple 1000,2000,2500,3000 formula. This shows that Hawaii and West Virginia have had far more cases per capita than upper New England has. | |
| 20:16, 22 October 2020 |  | 959 × 593 (44 KB) | TheNavigatrr | Updated Texas and Nevada. Accurate as of 10-22. | |
| 23:25, 21 October 2020 |  | 959 × 593 (44 KB) | TheNavigatrr | Updated Kansas. Accurate as of 10-21. | |
| 18:17, 21 October 2020 |  | 959 × 593 (44 KB) | TheNavigatrr | Correction for yesterday: Kentucky over 2000, minor adjustment to scale. | |
| 20:25, 20 October 2020 |  | 959 × 593 (44 KB) | TheNavigatrr | Updated New York, New Jersey, Wisconsin, and Utah. Adjusting scale to include Washington. | |
| 01:34, 20 October 2020 |  | 959 × 593 (44 KB) | TheNavigatrr | Updated Nebraska, Idaho. Accurate as of 10-19. | |
| 02:28, 18 October 2020 |  | 959 × 593 (44 KB) | TheNavigatrr | Updated scale and date. | |
| 03:41, 17 October 2020 |  | 959 × 593 (44 KB) | TheNavigatrr | Missouri | |
| 23:35, 16 October 2020 |  | 959 × 593 (44 KB) | TheNavigatrr | Updated Montana. Accurate as of 10-16. | |
| 21:18, 15 October 2020 |  | 959 × 593 (44 KB) | TheNavigatrr | Updated Guam, slight adjustment to the color scale that does not change any states/territories. | |
| 23:55, 13 October 2020 |  | 959 × 593 (44 KB) | TheNavigatrr | Updated Wyoming, results came in late | |
| 22:15, 13 October 2020 |  | 959 × 593 (44 KB) | TheNavigatrr | Updated Rhode Island, Alaska. Accurate as of 10-13. | |
| 20:45, 11 October 2020 |  | 959 × 593 (44 KB) | TheNavigatrr | Updated Indiana, Colorado, and Oklahoma. Accurate as of 10-11. | |
| 21:14, 10 October 2020 |  | 959 × 593 (44 KB) | TheNavigatrr | Updated Illinois, Wisconsin, Massachusetts. | |
| 01:10, 10 October 2020 |  | 959 × 593 (44 KB) | TheNavigatrr | Arkansas information came late. | |
| 20:51, 9 October 2020 |  | 959 × 593 (44 KB) | TheNavigatrr | Updated South Dakota. Accurate as of 10-09. | |
| 20:06, 8 October 2020 |  | 959 × 593 (44 KB) | TheNavigatrr | Updated South Carolina, Iowa. Accurate as of 10-08. | |
| 23:12, 7 October 2020 |  | 959 × 593 (44 KB) | TheNavigatrr | Updated Utah, Nebraska, corrected Virgin Islands. Slight alteration to scale. | |
| 00:31, 7 October 2020 |  | 959 × 593 (44 KB) | TheNavigatrr | mistake: forgot Idaho, which jumped from 2486 to 2523/100,000 people from yesterday to today. | |
| 23:06, 6 October 2020 |  | 959 × 593 (44 KB) | TheNavigatrr | Updated Tennessee. Accurate as of 10-06. | |
| 21:18, 3 October 2020 |  | 959 × 593 (44 KB) | TheNavigatrr | Updated North Dakota, slightly altered the threshold for the lowest color on the scale. Accurate as of 10-03. | |
| 20:53, 1 October 2020 |  | 959 × 593 (44 KB) | TheNavigatrr | Updated Georgia and Montana. Accurate as of 10-01. | |
| 20:25, 30 September 2020 |  | 959 × 593 (44 KB) | TheNavigatrr | Updated North Carolina. Changed the scale values to <1.25%, >1.25%, >2%, >2.5%, >3%. The map now accurately shows the South and parts of the Midwest as having greater infection rates than New York or California. It also shows Nevada's higher rate than its neighbors, and Texas' higher rate than states north of it. | |
| 23:04, 29 September 2020 |  | 959 × 593 (44 KB) | TheNavigatrr | Updated Kansas, Kentucky, Wyoming. Accurate as of 09-29. | |
| 01:59, 29 September 2020 |  | 959 × 593 (44 KB) | TheNavigatrr | Updated Iowa and North Dakota, accurate as of 09-28. | |
| 00:18, 27 September 2020 |  | 959 × 593 (44 KB) | TheNavigatrr | Updated Missouri and Alaska. Accurate as of 09-26. | |
| 21:53, 25 September 2020 |  | 959 × 593 (44 KB) | TheNavigatrr | Correction to Tennessee, results came in late | |
| 19:06, 25 September 2020 |  | 959 × 593 (44 KB) | TheNavigatrr | Updated South Carolina, Puerto Rico, and the scale. Accurate as of 09-25. | |
| 21:44, 23 September 2020 |  | 959 × 593 (44 KB) | TheNavigatrr | Updated Maryland and Oklahoma. Accurate as of 09-23. | |
| 04:43, 23 September 2020 |  | 959 × 593 (44 KB) | TheNavigatrr | Updated California and Montana. Accurate as of 09-22. | |
| 22:53, 21 September 2020 |  | 959 × 593 (44 KB) | TheNavigatrr | Updated Utah. Accurate as of 09-21. | |
| 00:59, 21 September 2020 |  | 959 × 593 (44 KB) | TheNavigatrr | Updated South Dakota, Delaware. Accurate as of 09-20. | |
| 04:54, 16 September 2020 |  | 959 × 593 (44 KB) | TheNavigatrr | Updated Nebraska and Idaho. Accurate as of 09-15. | |
| 22:48, 14 September 2020 |  | 959 × 593 (44 KB) | TheNavigatrr | Updated Minnesota. Accurate as of 09-14. | |
| 00:26, 14 September 2020 |  | 959 × 593 (44 KB) | TheNavigatrr | Updated North Dakota, accurate as of 09-13. | |
| 21:03, 12 September 2020 |  | 959 × 593 (44 KB) | TheNavigatrr | Updated Wisconsin and slightly altered final threshold without changing any states as a result. Accurate as of 09-12. | |
| 00:15, 12 September 2020 |  | 959 × 593 (44 KB) | TheNavigatrr | Changed the threshold of the last color so it does not include South Carolina. Otherwise no changes. Accurate as of September 11. | |
| 18:08, 9 September 2020 |  | 959 × 593 (44 KB) | TheNavigatrr | Updated Connecticut and Indiana. Accurate as of September 9. | |
| 20:32, 8 September 2020 |  | 959 × 593 (44 KB) | TheNavigatrr | Updated Illinois, Virginia, and Guam. Accurate as of September 8. Connecticut and Indiana should both be soon | |
| 01:08, 6 September 2020 |  | 959 × 593 (44 KB) | TheNavigatrr | Updated Missouri. Accurate as of 09-05. | |
| 00:40, 6 September 2020 |  | 959 × 593 (44 KB) | TheNavigatrr | Version that is valid as of September 4 (Washington) source: https://github.com/CSSEGISandData/COVID-19/blob/master/csse_covid_19_data/csse_covid_19_daily_reports_us/09-04-2020.csv | |
| 04:35, 4 September 2020 |  | 959 × 593 (44 KB) | TheNavigatrr | Updated D.C. Accurate as of 09-03. | |
| 23:47, 2 September 2020 |  | 959 × 593 (44 KB) | TheNavigatrr | Updated Kansas. Accurate as of 09-02. | |
| 03:43, 2 September 2020 |  | 959 × 593 (44 KB) | TheNavigatrr | Updated Oklahoma and Colorado. Accurate as of September 1. | |
| 23:58, 30 August 2020 |  | 959 × 593 (44 KB) | TheNavigatrr | Updated Arkansas, South Dakota, and US Virgin Islands. Accurate as of 08-30. | |
| 21:37, 29 August 2020 |  | 959 × 593 (44 KB) | TheNavigatrr | Updated Georgia, Alabama, Iowa, and North Dakota. Accurate as of 08-29. | |
| 21:16, 27 August 2020 |  | 959 × 593 (44 KB) | TheNavigatrr | Updated Kentucky, accurate as of 08-27 | |
| 21:51, 26 August 2020 |  | 959 × 593 (44 KB) | TheNavigatrr | Updated Ohio, accurate as of 08-26 | |
| 20:05, 25 August 2020 |  | 959 × 593 (44 KB) | TheNavigatrr | Updated North Carolina, accurate as of 08-25. | |
| 04:20, 25 August 2020 |  | 959 × 593 (44 KB) | TheNavigatrr | Updated Rhode Island and Puerto Rico. Accurate as of 08-24. | |
| 20:11, 21 August 2020 |  | 959 × 593 (44 KB) | TheNavigatrr | Updated for 8-21, changing Texas and Utah. | |
| 20:14, 19 August 2020 |  | 959 × 593 (44 KB) | TheNavigatrr | New color scheme accounts for the difference between Louisiana/Mississippi/Florida/Arizona and neighboring states. Updated Tennessee to over 2,000. | |
| 20:27, 17 August 2020 |  | 959 × 593 (44 KB) | TheNavigatrr | Checked all states again, updated Nevada. | |
| 19:36, 15 August 2020 |  | 959 × 593 (44 KB) | TheNavigatrr | Updated Pennsylvania and Idaho. Accurate as of 8/15. | |
| 17:09, 14 August 2020 |  | 959 × 593 (44 KB) | TheNavigatrr | Updated California, Michigan, South Carolina. Accurate as of August 14. | |
| 01:13, 12 August 2020 |  | 959 × 593 (44 KB) | TheNavigatrr | Updated Nebraska, which is at 1,500.72 per 100,000 people. All locations are now accurate. | |
| 22:13, 11 August 2020 |  | 959 × 593 (44 KB) | TheNavigatrr | Updated Missouri. | |
| 04:35, 11 August 2020 |  | 959 × 593 (44 KB) | TheNavigatrr | Updated North Dakota. All states still accurate. | |
| 20:50, 8 August 2020 |  | 959 × 593 (44 KB) | TheNavigatrr | Updated Georgia. | |
| 21:34, 7 August 2020 |  | 959 × 593 (44 KB) | TheNavigatrr | Updated Illinois, Wisconsin, Alabama. | |
| 00:30, 7 August 2020 |  | 959 × 593 (44 KB) | TheNavigatrr | Updated Iowa and checked all states. | |
| 00:37, 6 August 2020 |  | 959 × 593 (44 KB) | TheNavigatrr | Updated Oklahoma, Kansas. Checked all states. | |
| 03:24, 5 August 2020 |  | 959 × 593 (44 KB) | TheNavigatrr | Updated Arkansas and made a slight adjustment to the scale that didn't change any state/territory color. Accurate as of August 4. | |
| 22:44, 2 August 2020 |  | 959 × 593 (44 KB) | TheNavigatrr | Updated New Mexico. Accurate as of August 2. | |
| 21:32, 1 August 2020 |  | 959 × 593 (44 KB) | TheNavigatrr | Updated Texas, Mississippi, Indiana, and South Dakota. Accurate as of August 1. | |
| 20:57, 30 July 2020 |  | 959 × 593 (44 KB) | TheNavigatrr | Updated Tennessee, Delaware, Nevada. Accurate as of July 30 | |
| 18:58, 27 July 2020 |  | 959 × 593 (44 KB) | TheNavigatrr | Updated Florida, Virginia, Idaho. Accurate as of 7/27 | |
| 20:05, 26 July 2020 |  | 959 × 593 (43 KB) | TheNavigatrr | Updated date and fixed American Samoa (no cases) and Puerto Rico (now has >500 per 100K). All other states still accurate. | |
| 21:46, 24 July 2020 |  | 959 × 593 (43 KB) | TheNavigatrr | Corrected Puerto Rico and updated the map to show Delaware is not over 1500 cases (but all the other states that were over 1400 have since gone to over 1500) | |
| 20:56, 22 July 2020 |  | 959 × 593 (43 KB) | TheNavigatrr | fixed issue in my previous edit: Maine, NH, Vermont were incorrectly marked as >500 and PA was incorrectly marked as >1,000 | |
| 20:48, 22 July 2020 |  | 959 × 593 (43 KB) | TheNavigatrr | Updated again according to current data. | |
| 19:36, 6 July 2020 |  | 959 × 593 (42 KB) | TheNavigatrr | Ythlev, since it is more than a month old, I decided to update it with what I thought were sensible numbers. It shows that the South and Midwest are seeing greater than 1% infection in some places | |
| 18:25, 4 June 2020 |  | 959 × 593 (36 KB) | Ythlev | ce | |
| 19:09, 31 May 2020 |  | 959 × 593 (36 KB) | Ythlev | update | |
| 09:57, 28 May 2020 |  | 959 × 593 (36 KB) | Ythlev | new formula | |
| 04:33, 28 May 2020 |  | 959 × 593 (36 KB) | Ythlev | update | |
| 04:28, 26 May 2020 |  | 959 × 593 (36 KB) | Ythlev | update | |
| 02:32, 24 May 2020 |  | 959 × 593 (36 KB) | Ythlev | ce | |
| 11:48, 22 May 2020 |  | 959 × 593 (36 KB) | Ythlev | ce | |
| 06:35, 21 May 2020 |  | 959 × 593 (36 KB) | Ythlev | update | |
| 07:35, 17 May 2020 |  | 959 × 593 (36 KB) | Ythlev | update | |
| 07:29, 14 May 2020 |  | 959 × 593 (36 KB) | Ythlev | update | |
| 07:08, 11 May 2020 |  | 959 × 593 (36 KB) | Ythlev | update | |
| 05:11, 8 May 2020 |  | 959 × 593 (36 KB) | Ythlev | ce |
File usage
The following pages on the English Wikipedia use this file (pages on other projects are not listed):
- 2020 in the United States
- COVID-19 pandemic in North America
- COVID-19 pandemic in the United States
- Talk:COVID-19 pandemic in India/Archive 2
- User:Dtester10/2020
- User:Toast for Teddy/sandbox
- User talk:اُردو
- Wikipedia:Top 25 Report/April 12 to 18, 2020
- Wikipedia:Top 25 Report/April 19 to 25, 2020
- Wikipedia:Top 25 Report/April 26 to May 2, 2020
- Wikipedia:Top 25 Report/April 5 to 11, 2020
- Wikipedia:Top 25 Report/March 29 to April 4, 2020
- Wikipedia:Wikipedia Signpost/2020-04-26/Traffic report
- Template:COVID-19 pandemic in the United States imagemap
Global file usage
The following other wikis use this file:
- Usage on ar.wikipedia.org
- Usage on bh.wikipedia.org
- Usage on bn.wikipedia.org
- Usage on cs.wikipedia.org
- Usage on de.wikipedia.org
- Usage on es.wikipedia.org
- Usage on fa.wikipedia.org
- Usage on fi.wikipedia.org
- Usage on fr.wikipedia.org
- Usage on ga.wikipedia.org
- Usage on id.wikipedia.org
- Usage on it.wikipedia.org
- Usage on ja.wikipedia.org
- Usage on jv.wikipedia.org
- Usage on min.wikipedia.org
- Usage on ms.wikipedia.org
- Usage on my.wikipedia.org
- Usage on pl.wikipedia.org
- Usage on pnb.wikipedia.org
- Usage on ru.wikipedia.org
- Usage on sd.wikipedia.org
- Usage on simple.wikipedia.org
- Usage on sq.wikipedia.org
- Usage on ta.wikipedia.org
- Usage on test.wikipedia.org
- Usage on th.wikipedia.org
- Usage on ug.wikipedia.org
- Usage on uk.wikipedia.org
- Usage on ur.wikipedia.org
- Usage on uz.wikipedia.org
- Usage on vi.wikipedia.org
- Usage on zh.wikipedia.org