1954 Australian federal election
| ||||||||||||||||||||||||||||||||||
All 121 seats of the House of Representatives 61 seats were needed for a majority | ||||||||||||||||||||||||||||||||||
|---|---|---|---|---|---|---|---|---|---|---|---|---|---|---|---|---|---|---|---|---|---|---|---|---|---|---|---|---|---|---|---|---|---|---|
| ||||||||||||||||||||||||||||||||||
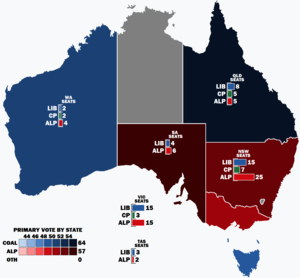
 Popular vote by state with graphs indicating the number of seats won. As this is an IRV election, seat totals are not determined by popular vote by state but instead via results in each electorate. | ||||||||||||||||||||||||||||||||||
| ||||||||||||||||||||||||||||||||||
The 1954 Australian federal election were held in Australia on 29 May 1954. All 121 seats in the House of Representatives were up for election, but no Senate election took place. The incumbent Liberal–Country coalition led by Prime Minister Robert Menzies defeated the opposition Labor Party led by H. V. Evatt, despite losing the two-party preferred vote.
This was the first federal election that future Prime Minister Gough Whitlam contested as a member of parliament, having entered parliament at the 1952 Werriwa by-election.
Issues
The election was complicated by the Petrov Affair, in which Vladimir Petrov, an attache to the Soviet embassy in Canberra, defected amidst a storm of publicity, claiming that there were Soviet spy rings within Australia. Given that the 1951 election had been fought over the issue of banning the Communist Party of Australia altogether, it is unsurprising that such a claim would gain credibility.[citation needed]
Results

| Party | Votes | % | Swing | Seats | Change | ||
|---|---|---|---|---|---|---|---|
| Labor | 2,266,979 | 50.07 | +2.44 | 57 | +5 | ||
| Liberal–Country coalition | 2,153,970 | 47.57 | –2.77 | 64 | –5 | ||
| Liberal | 1,765,799 | 39.00 | –1.62 | 47 | –5 | ||
| Country | 388,171 | 8.57 | –1.15 | 17 | 0 | ||
| Communist | 56,675 | 1.25 | +0.27 | 0 | 0 | ||
| Independents | 50,027 | 1.11 | +0.06 | 0 | 0 | ||
| Total | 4,527,651 | 121 | |||||
| Two-party-preferred (estimated) | |||||||
| Liberal–Country coalition | WIN | 49.30 | −1.40 | 64 | −5 | ||
| Labor | 50.70 | +1.40 | 57 | +5 | |||
- Notes
- Seven members were elected unopposed – three Liberal, three Country, and one Labor.
- See 1953 Australian Senate election for Senate composition.
Seats changing hands
| Seat | Pre-1954 | Swing | Post-1954 | ||||||
|---|---|---|---|---|---|---|---|---|---|
| Party | Member | Margin | Margin | Member | Party | ||||
| Bass, Tas | Liberal | Bruce Kekwick | 3.4 | 4.4 | 1.0 | Lance Barnard | Labor | ||
| Flinders, Vic | Labor | Keith Ewert | 5.1 | 4.3 | 1.6 | Robert Lindsay | Liberal | ||
| Griffith, Qld | Liberal | Doug Berry | 3.7 | 4.1 | 0.4 | Wilfred Coutts | Labor | ||
| St George, NSW | Liberal | Bill Graham | 1.6 | 4.3 | 2.7 | Nelson Lemmon | Labor | ||
| Sturt, SA | Liberal | Keith Wilson | 2.4 | 5.4 | 3.0 | Norman Makin | Labor | ||
| Swan, WA | Liberal | Bill Grayden | 3.3 | 4.9 | 1.6 | Harry Webb | Labor | ||
Aftermath
The 20th session of the Parliament of the Commonwealth of Australia was officially opened by Her Majesty Queen Elizabeth II, Queen of Australia. This was the first time a reigning monarch had opened a session of parliament in Australia. The Queen wore her Coronation Dress to open the 20th session of parliament. The success of the 1954 Royal Tour of Australia (the first by a reigning sovereign), the recovery of the economy from a brief recession in 1951-52 and the Petrov Affair were all credited with assisting in the return of the government.
See also
- Candidates of the Australian federal election, 1954
- Members of the Australian House of Representatives, 1954–1955
References
- University of WA election results in Australia since 1890
- AEC 2PP vote
- Prior to 1984 the AEC did not undertake a full distribution of preferences for statistical purposes. The stored ballot papers for the 1983 election were put through this process prior to their destruction. Therefore, the figures from 1983 onwards show the actual result based on full distribution of preferences.


