List of Mexican states by Indigenous-speaking population
Appearance
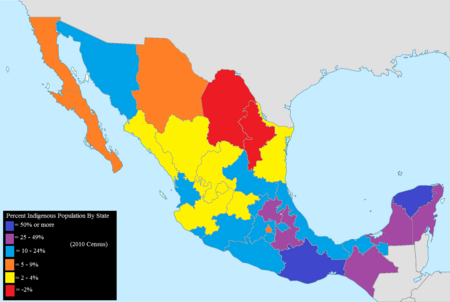
Mexican states by population and percentage being indigenous speaking Mexicans.


States
| Rank | State | Speaking Population (2010)[1] | Percentage |
|---|---|---|---|
| 1 | 1,165,186 | 34.2% | |
| 2 | 537,516 | 30.3% | |
| 3 | 1,141,499 | 27.2% | |
| 4 | 196,060 | 16.7% | |
| 5 | 456,774 | 15.1% | |
| 6 | 359,972 | 15.1% | |
| 7 | 91,094 | 12.3% | |
| 8 | 601,680 | 11.7% | |
| 9 | 248,196 | 10.7% | |
| 10 | 644,559 | 9.4% | |
| - | 6,695,228 | 6.7% | |
| 11 | 49,963 | 5.1% | |
| 12 | 136,608 | 3.5% | |
| 13 | 104,014 | 3.5% | |
| 14 | 60,526 | 3.0% | |
| 15 | 376,830 | 2.8% | |
| 16 | 27,653 | 2.6% | |
| 17 | 60,310 | 2.5% | |
| 18 | 30,894 | 2.1% | |
| 19 | 31,388 | 2.0% | |
| 20 | 10,661 | 1.9% | |
| 21 | 29,585 | 1.8% | |
| 22 | 122,411 | 1.5% | |
| 23 | 41,005 | 1.5% | |
| 24 | 40,137 | 1.0% | |
| 25 | 23,426 | 0.9% | |
| 26 | 23,296 | 0.8% | |
| 27 | 51,702 | 0.8% | |
| 28 | 3,983 | 0.7% | |
| 29 | 4,924 | 0.4% | |
| 30 | 14,835 | 0.3% | |
| 31 | 6,105 | 0.2% | |
| 32 | 2,436 | 0.2% |
See also
- Languages of Mexico
- Indigenous peoples of Mexico
- Ranked list of Mexican states
- List of Mexican states by HDI
References
- ^ "Cuéntame INEGI". Retrieved February 26, 2013.
