
Northampton Borough Council elections
Northampton Borough Council in Northamptonshire, England is elected every four years. Since the last boundary changes in 1999, 47 councillors have been elected from 23 wards.[1]
Political control
Since the first election to the council in 1973 political control of the council has been held by the following parties:[2]
| Party in control | Years |
|---|---|
| Labour | 1973 - 1976 |
| Conservative | 1976 - 1983 |
| No overall control | 1983 - 1987 |
| Conservative | 1987 - 1991 |
| No overall control | 1991 - 1995 |
| Labour | 1995 - 2003 |
| No overall control | 2003 - 2007 |
| Liberal Democrats | 2007 - 2011 |
| Conservative | 2011–present |
Council elections
- 1973 Northampton Borough Council election
- 1976 Northampton Borough Council election
- 1979 Northampton Borough Council election (New ward boundaries)[3]
- 1983 Northampton Borough Council election
- 1987 Northampton Borough Council election
- 1991 Northampton Borough Council election
- 1995 Northampton Borough Council election
- 1999 Northampton Borough Council election (New ward boundaries increased the number of seats by 4)[4][5]
- 2003 Northampton Borough Council election
- 2007 Northampton Borough Council election
- 2011 Northampton Borough Council election (New ward boundaries)[6]
- 2015 Northampton Borough Council election
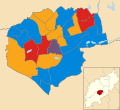
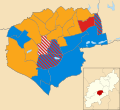
Borough result maps
-
 1999 results map
 -
 2003 results map
 -
 2007 results map
 -
 2011 results map
 -
 2015 results map


By-election results
1995-1999
| Party | Candidate | Votes | % | ±% | |
|---|---|---|---|---|---|
| Liberal Democrats | 1,435 | 38.5 | -4.4 | ||
| Labour | 1,235 | 33.1 | -2.2 | ||
| Conservative | 1,059 | 28.4 | +6.6 | ||
| Majority | 200 | 5.4 | |||
| Turnout | 3,729 | ||||
| Liberal Democrats hold | Swing | ||||
| Party | Candidate | Votes | % | ±% | |
|---|---|---|---|---|---|
| Labour | 1,867 | 58.6 | -17.1 | ||
| Conservative | 841 | 26.4 | +10.3 | ||
| Liberal Democrats | 407 | 12.8 | +4.5 | ||
| UKIP | 71 | 2.2 | +2.2 | ||
| Majority | 1,026 | 32.2 | |||
| Turnout | 3,186 | ||||
| Labour hold | Swing | ||||
| Party | Candidate | Votes | % | ±% | |
|---|---|---|---|---|---|
| Labour | 1,662 | 46.1 | -16.4 | ||
| Conservative | 1,307 | 36.2 | +9.3 | ||
| Liberal Democrats | 640 | 17.7 | +7.0 | ||
| Majority | 355 | 9.9 | |||
| Turnout | 3,609 | ||||
| Labour hold | Swing | ||||
| Party | Candidate | Votes | % | ±% | |
|---|---|---|---|---|---|
| Labour | 551 | 65.9 | -3.5 | ||
| Liberal Democrats | 113 | 13.5 | -7.5 | ||
| Conservative | 96 | 11.5 | +1.9 | ||
| Green_Party_of_England_and_Wales | 45 | 5.4 | +5.4 | ||
| Independent | 31 | 3.7 | +3.7 | ||
| Majority | 438 | 52.4 | |||
| Turnout | 836 | 16.7 | |||
| Labour hold | Swing | ||||
2003-2007
| Party | Candidate | Votes | % | ±% | |
|---|---|---|---|---|---|
| Liberal Democrats | Roger Conroy | 635 | 42.2 | +16.7 | |
| Labour | Alan Scott | 546 | 36.3 | -7.2 | |
| Conservative | Laura Norman | 265 | 17.6 | -13.4 | |
| Green_Party_of_England_and_Wales | Marcus Rock | 33 | 2.2 | +2.2 | |
| CPA | Antony Solomon | 25 | 1.7 | +1.7 | |
| Majority | 89 | 5.9 | |||
| Turnout | 1,504 | 28.5 | |||
| Liberal Democrats gain from Labour | Swing | ||||
2007-2011
| Party | Candidate | Votes | % | ±% | |
|---|---|---|---|---|---|
| Conservative | Matthew Golby | 1,072 | 53.0 | +9.7 | |
| Labour | Geoff Howes | 322 | 15.9 | -1.3 | |
| Independent | David Huffadine-Smith | 320 | 15.8 | -3.8 | |
| Liberal Democrats | Marion Allen-Minney | 307 | 15.2 | +7.0 | |
| Majority | 750 | 37.1 | |||
| Turnout | 2,021 | 32.2 | |||
| Conservative hold | Swing | ||||
2015-2019
| Party | Candidate | Votes | % | ±% | |
|---|---|---|---|---|---|
| Liberal Democrats | Brian Markham | 583 | 49.7 | +36.4 | |
| Conservative | Gregory Lunn | 319 | 27.2 | -28.7 | |
| Labour | Toby Birch | 270 | 23.0 | -7.6 | |
| Majority | 264 | 23.4 | |||
| Turnout | 1127 | 33 | |||
| Liberal Democrats gain from Conservative | Swing | ||||
| Party | Candidate | Votes | % | ±% | |
|---|---|---|---|---|---|
| Labour | Paul Joyce | 493 | 50.5 | +13.5 | |
| Conservative | Pauline Woodhouse | 288 | 29.5 | -4.1 | |
| Liberal Democrats | Martin Sawyer | 195 | 20.0 | +16.7 | |
| Majority | 205 | 20.9 | |||
| Turnout | 980 | 27 | |||
| Labour hold | Swing | ||||
| Party | Candidate | Votes | % | ±% | |
|---|---|---|---|---|---|
| Conservative | Luke Graystone | 803 | 52.5 | +11.7 | |
| Labour | Nikesh Jani | 343 | 22.4 | +7.6 | |
| Liberal Democrats | Brian Hoare | 293 | 19.2 | +9.0 | |
| Green | Denise Donaldson | 91 | 5.9 | +5.9 | |
| Majority | |||||
| Turnout | 1530 | 18.2 | |||
| Conservative hold | Swing | ||||
References
- ^ "Borough Council Elections". Northampton Borough Council. Archived from the original on 2011-05-10. Retrieved 2009-09-15.
- ^ "Northampton". BBC News Online. Retrieved 2009-09-15.
- ^ The Borough of Northampton (Electoral Arrangements) Order 1978
- ^ "Northampton". BBC News Online. Retrieved 2009-09-15.
- ^ legislation.gov.uk - The Borough of Northampton (Electoral Changes) Order 1998. Retrieved on 4 October 2015.
- ^ legislation.gov.uk - The Northampton (Electoral Changes) Order 2011. Retrieved on 3 November 2015.
- ^ "Lib Dems triumph in council byelection". guardian.co.uk. 2006-02-10. Retrieved 2009-09-15.
- ^ "Tories hold Duston in by-election". Northampton Chronicle & Echo. 2009-01-23. Retrieved 2009-09-15.
- ^ "Declaration of Result of Poll - Westone". www.northampton.gov.uk. Northampton Borough Council. Retrieved 10 December 2016.