From Wikipedia, the free encyclopedia
2002 Slovak parliamentary election|
|
|
| Turnout | 2,913,267 (70.07%)
 14.18 pp 14.18 pp |
|---|
|
|
First party
|
Second party
|
Third party
|
|
|
|
|

|
| Leader
|
Vladimír Mečiar
|
Mikuláš Dzurinda
|
Robert Fico
|
| Party
|
ĽS–HZDS
|
SDKÚ
|
SMER–SD
|
| Last election
|
43 seats, 27.0%
|
New party
|
New party
|
| Seats won
|
36
|
28
|
25
|
| Seat change
|
7
|
New party
|
New party
|
| Popular vote
|
560,691
|
433,953
|
387,100
|
| Percentage
|
19.5%
|
15.1%
|
13.5%
|
| Swing
|
7.5 pp
|
New party
|
New party
|
|
|
|
Fourth party
|
Fifth party
|
Sixth party
|
|
|

|

|

|
| Leader
|
Béla Bugár
|
Pavol Hrušovský
|
Pavol Rusko
|
| Party
|
SMK
|
KDH
|
ANO
|
| Last election
|
15 seats, 9.1%
|
In SDK
|
New party
|
| Seats won
|
20
|
15
|
15
|
| Seat change
|
 5 5
|
N/A
|
New party
|
| Popular vote
|
321,069
|
237,202
|
237,202
|
| Percentage
|
11.2%
|
8.3%
|
8.0%
|
| Swing
|
2.0 pp
|
N/A
|
New party
|
|
|
|
Seventh party
|
|
|
|
|
|
| Leader
|
Jozef Ševc
|
|
| Party
|
KSS
|
|
| Last election
|
0 seats, 2.8%
|
|
| Seats won
|
11
|
|
| Seat change
|
11
|
|
| Popular vote
|
181,872
|
|
| Percentage
|
6.3%
|
|
| Swing
|
3.5 pp
|
|
|
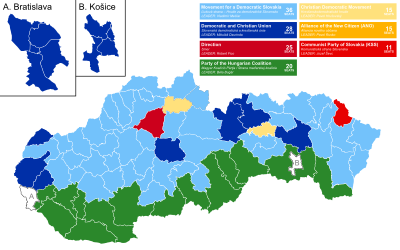 Results of the election, showing plurality by district. |
|
Parliamentary elections were held in Slovakia on 20 and 21 September 2002.[1] The People's Party – Movement for a Democratic Slovakia remained the largest party in the National Council, winning 36 of the 150 seats.[2] Mikuláš Dzurinda of the Slovak Democratic and Christian Union remained Prime Minister, in coalition with the Party of the Hungarian Coalition, Christian Democratic Movement, and Alliance of the New Citizen parties.[3]
Results

|
| Party
|
Votes
|
%
|
Swing
|
Seats
|
+/–
|
| bgcolor=Template:People's Party – Movement for a Democratic Slovakia/meta/color|
|
People's Party – Movement for a Democratic Slovakia
|
560,691 |
19.50 |
–7.50 |
36 |
–7
|
| bgcolor=Template:Slovak Democratic and Christian Union – Democratic Party/meta/color|
|
Slovak Democratic and Christian Union
|
433,953 |
15.09 |
New |
28 |
New
|
| bgcolor=Template:Direction – Social Democracy/meta/color|
|
Direction
|
387,100 |
13.46 |
New |
25 |
New
|
| bgcolor=Template:Party of the Hungarian Community/meta/color|
|
Party of the Hungarian Coalition
|
321,069 |
11.17 |
+2.04 |
20 |
+5
|
| bgcolor=Template:Christian Democratic Movement/meta/color|
|
Christian Democratic Movement
|
237,202 |
8.25 |
N/A |
15 |
N/A
|
| bgcolor=Template:Alliance of the New Citizen/meta/color|
|
Alliance of the New Citizen
|
230,309 |
8.01 |
New |
15 |
New
|
| bgcolor=Template:Communist Party of Slovakia/meta/color|
|
Communist Party of Slovakia
|
181,872 |
6.33 |
+3.53 |
11 |
+11
|
|
|
True Slovak National Party
|
105,084 |
3.65 |
New |
0 |
New
|
| bgcolor=Template:Slovak National Party/meta/color|
|
Slovak National Party
|
95,633 |
3.33 |
–5.75 |
0 |
–14
|
|
|
Movement for Democracy
|
94,324 |
3.28 |
New |
0 |
New
|
|
|
Social Democratic Alternative
|
51,649 |
1.80 |
New |
0 |
New
|
|
|
Party of the Democratic Left
|
39,163 |
1.36 |
–13.30 |
0 |
–23
|
|
|
Green Party
|
28,365 |
0.99 |
New |
0 |
New
|
|
|
Independent Civic Party of the Unemployed and Injured
|
26,205 |
0.91 |
New |
0 |
New
|
| bgcolor=Template:Union of the Workers of Slovakia/meta/color|
|
Union of the Workers of Slovakia
|
15,755 |
0.55 |
–0.76 |
0 |
0
|
|
|
Woman and Family
|
12,646 |
0.44 |
New |
0 |
New
|
|
|
Civic Conservative Party
|
9,422 |
0.33 |
New |
0 |
New
|
|
|
Workers' Party–ROSA
|
8,699 |
0.30 |
New |
0 |
New
|
|
|
Roma Civic Initiative
|
8,420 |
0.29 |
New |
0 |
New
|
|
|
Party for Democratic Civic Rights
|
6,716 |
0.23 |
New |
0 |
New
|
|
|
Left Bloc
|
6,441 |
0.22 |
New |
0 |
New
|
|
|
Political Movement of Roma in Slovakia–ROMA
|
6,234 |
0.22 |
New |
0 |
New
|
|
|
Slovak National Unity
|
4,548 |
0.16 |
+0.02 |
0 |
0
|
|
|
B–Revolutionary Workers' Party
|
2,818 |
0.10 |
–0.03 |
0 |
0
|
|
|
People's Party
|
763 |
0.03 |
New |
0 |
New
|
| Invalid/blank votes |
38,186 |
– |
– |
– |
–
|
| Total |
2,913,267 |
100 |
– |
150 |
0
|
| Registered voters/turnout |
4,157,802 |
70.07 |
–14.18 |
– |
–
|
| Source: Nohlen & Stöver
|
| Popular vote |
|---|
|
|
|
| ĽS-HZDS |
|
19.50% |
| SDKÚ-DS |
|
15.09% |
| SMER-SD |
|
13.46% |
| SMK |
|
11.17% |
| KDH |
|
8.25% |
| ANO |
|
8.01% |
| KSS |
|
6.33% |
| Other |
|
18.19% |
|
| Parliamentary seats |
|---|
|
|
|
| ĽS-HZDS |
|
24.00% |
| SDKÚ-DS |
|
18.67% |
| SMER-SD |
|
16.67% |
| SMK |
|
13.33% |
| KDH |
|
10.00% |
| ANO |
|
10.00% |
| KSS |
|
7.33% |
|
References
External links


a.jpg)


