Baldur, Manitoba
Appearance
Baldur | |
|---|---|
 The grain elevator and park in Baldur. | |
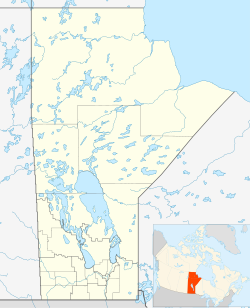
| Coordinates: 49°23′08″N 99°14′37″W / 49.38556°N 99.24361°W | |
| Country | Canada |
| Province | Manitoba |
| Area | |
| • Total | 2.21 km2 (0.85 sq mi) |
| Population (2016)[1] | |
| • Total | 320 |
| • Density | 144.9/km2 (375/sq mi) |
| Time zone | UTC−5 (CST) |
| • Summer (DST) | UTC−6 (CDT) |
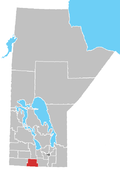
Baldur is an unincorporated community recognized as a local urban district[2] in the Canadian province of Manitoba, located in the Rural Municipality of Argyle. Baldur is the largest community of the municipality, which is in southwestern Manitoba between Brandon and Portage la Prairie. The community is named after the Norse god Baldur.
History
The community was founded in 1890 with the coming of the railway. Its name reflects the Icelandic heritage of the people in the community.
Notable people
- It is the birthplace of Hockey Hall of Famer Tom Johnson.
- It is the birthplace of award-winning author and naturalist Bill Stilwell
- It was where the Icelandic businessman Hallgrímur Fr. Hallgrímsson (1905–84) went to high school.
Climate
| Climate data for Baldur | |||||||||||||
|---|---|---|---|---|---|---|---|---|---|---|---|---|---|
| Month | Jan | Feb | Mar | Apr | May | Jun | Jul | Aug | Sep | Oct | Nov | Dec | Year |
| Record high °C (°F) | 8.9 (48.0) |
13.5 (56.3) |
21.7 (71.1) |
36 (97) |
37 (99) |
37.2 (99.0) |
37.8 (100.0) |
39.5 (103.1) |
38.3 (100.9) |
34 (93) |
24.5 (76.1) |
15.6 (60.1) |
39.5 (103.1) |
| Mean daily maximum °C (°F) | −10.7 (12.7) |
−6.9 (19.6) |
−0.4 (31.3) |
10.4 (50.7) |
19 (66) |
23.1 (73.6) |
25.6 (78.1) |
25.4 (77.7) |
18.8 (65.8) |
11.4 (52.5) |
0 (32) |
−8.2 (17.2) |
9 (48) |
| Daily mean °C (°F) | −16.4 (2.5) |
−12.7 (9.1) |
−5.9 (21.4) |
3.6 (38.5) |
11.6 (52.9) |
16.4 (61.5) |
18.8 (65.8) |
18 (64) |
11.9 (53.4) |
4.9 (40.8) |
−4.9 (23.2) |
−13.5 (7.7) |
2.6 (36.7) |
| Mean daily minimum °C (°F) | −22.1 (−7.8) |
−18.5 (−1.3) |
−11.4 (11.5) |
−3.1 (26.4) |
4.2 (39.6) |
9.6 (49.3) |
12 (54) |
10.5 (50.9) |
4.9 (40.8) |
−1.5 (29.3) |
−9.8 (14.4) |
−18.8 (−1.8) |
−3.7 (25.3) |
| Record low °C (°F) | −41.1 (−42.0) |
−42.5 (−44.5) |
−36 (−33) |
−29.4 (−20.9) |
−10.6 (12.9) |
−2.8 (27.0) |
1.1 (34.0) |
−4 (25) |
−7.8 (18.0) |
−22.5 (−8.5) |
−35.5 (−31.9) |
−39 (−38) |
−42.5 (−44.5) |
| Average precipitation mm (inches) | 22.9 (0.90) |
23.4 (0.92) |
26.4 (1.04) |
32.2 (1.27) |
62.6 (2.46) |
91.7 (3.61) |
69.2 (2.72) |
73.8 (2.91) |
49.8 (1.96) |
39.3 (1.55) |
26.8 (1.06) |
25.4 (1.00) |
542.5 (21.36) |
| Source: Environment Canada[3] | |||||||||||||
References
- ^ "Census Profile". 2016 Census. Statistics Canada.
- ^ "Local Urban Districts Regulation". Government of Manitoba. April 23, 2016. Retrieved April 24, 2016.
- ^ Environment Canada - Canadian Climate Normals 1971-2000—Canadian Climate Normals 1971–2000, accessed 08 March 2011
External links
Wikimedia Commons has media related to Baldur, Manitoba.


