From Wikipedia, the free encyclopedia
Danish general election, 1966 Turnout 88.2%
First party
Second party
Third party
Leader
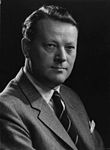
Jens Otto Krag
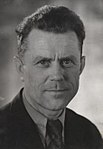
Poul Hartling
Poul Sørensen
Party
Social Democrats
Venstre
Conservatives
Last election
76 seats, 41.9%
38 seats, 20.8%
36 seats, 20.1%
Seats won
69
35
34
Seat change
Popular vote
1,068,911
539,027
522,028
Percentage
38.2%
19.3%
18.7%
Fourth party
Fifth party
Sixth party
Leader
Aksel Larsen
Karl Skytte
Bent Noack
Party
SF
Social Liberals
Liberal Centre
Last election
10 seats, 5.8%
10 seats, 5.3%
New
Seats won
20
13
4
Seat change
Popular vote
304,437
203,858
69,180
Percentage
10.9%
7.3%
2.5%
General elections were held in Denmark on 22 November 1966,[ 1] Social Democratic Party remained the largest in the Folketing , with 69 of the 179 seats. Voter turnout was 88.6% in Denmark proper, 48.8% in the Faroe Islands and 59.0% in Greenland (where only one of the two constituencies was contested as the other had only one candidate who was elected unopposed).[ 2]
Results
Denmark
Party
Votes
%
Seats
+/–
Social Democratic Party 1,068,911
38.2
69
–7
Venstre 539,027
19.3
35
–3
Conservative People's Party 522,028
18.7
34
–2
Socialist People's Party 304,437
10.9
20
+10
Danish Social Liberal Party 203,858
7.3
13
+3
Liberal Centre 69,180
2.5
4
New
Independent Party 44,994
1.6
0
–5
Communist Party of Denmark 21,553
0.8
0
0
Justice Party of Denmark 19,905
0.7
0
0
Independents
114
0.0
0
0
Invalid/blank votes
8,297
–
–
–
Total 2,802,304 100 175 0
Faroe Islands
Social Democratic Party 3,864
36.6
1
0
People's Party 3,549
33.6
1
+1
Union Party 3,156
29.9
0
–1
Invalid/blank votes
52
–
–
–
Total 10,621 100 2 0
Greenland
Independents
6,522
100
2
0
Invalid/blank votes
138
–
–
–
Total 6,660 100 2 0
Source: Nohlen & Stöver
Popular vote
A
38.26%
D
19.29%
C
18.68%
F
10.90%
B
7.30%
L
2.48%
U
1.61%
K
0.77%
E
0.71%
Others
0.00%
By constitutency
Candidate
Party
Votes
%
Notes
Greenland (Northern Constituency)
Knud Hertling Independent
Uncontested
Elected
Greenland (Southern Constituency)
Nikolaj Rosing Independent
3,677
56.3
Elected
Ulrik Rosing
Inuit Party
1,367
20.9
Erling Høegh
Independent
1,291
19.8
Jørgen Olsen
Independent
200
3.1
Invalid/blank votes
130
–
Total 6,665 100
Source: Atuagagdliutit[ 3]
References
^ Nohlen, D & Stöver, P (2010) Elections in Europe: A data handbook , p524 ISBN 978-3-8329-5609-7^ Nohlen & Stöver, pp542-543
^ Atuagagdliutit/Grønlandsposten 9 December 1966, p. 3


