From Wikipedia, the free encyclopedia
Laois County Council election, 1991
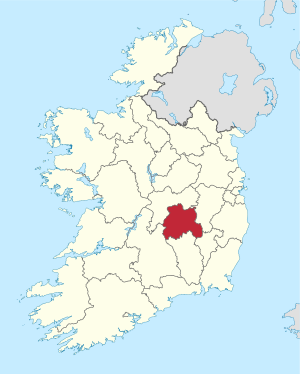
Map showing the area of Laois County Council
Council control before election Fianna Fáil
Council control after election Fianna Fáil
An election to Laois County Council that year's Irish local elections . 25 councillors were elected from five electoral divisions by PR-STV voting for a five-year term of office.
Results by party
style="width: 2px; color:inherit; background-color: #66BB66;" data-sort-value="Fianna Fáil" |
style="width: 2px; color:inherit; background-color: #6699FF;" data-sort-value="Fine Gael" |
style="width: 2px; color:inherit; background-color: #CC0000;" data-sort-value="Labour Party (Ireland)" |
style="width: 2px; color:inherit; background-color: #1251A2;" data-sort-value="Progressive Democrats" |
style="width: 2px; color:inherit; background-color: #DCDCDC;" data-sort-value="Independent (politician)" |
Results by Electoral Area
Borris-in-Ossory
Borris-in-Ossory - 7 seats
Party
Candidate
FPv% Count
1
2
3
4
5
6
7
8
9
Fianna Fáil
Liam Hyland TD18%
1,219
Independent
Jimmy Kelly *
12.2%
828
856
Fianna Fáil
Kieran Phelan 11.1%
751
816
818
861
Fine Gael
William Mansfield *
10.7%
728
749
751
819
826
898
Labour
Larry Kavanagh
8.8%
594
617
618
630
631
729
735
844
917
Fianna Fáil
Eamon Rafter *
8%
539
590
591
629
633
638
638
726
754
Fine Gael
Marty Phelan
7%
476
513
513
576
576
601
612
644
902
Fine Gael
Stephen Murphy
6.11
411
425
425
433
433
455
487
496
Fianna Fáil
Thomas Fennelly
5.8%
392
446
447
447
451
457
457
555
624
Fianna Fáil
Fintan Phelan*
4.4%
299
365
366
376
377
412
413
Fine Gael
Patrick McMahon*
4%
272
276
276
278
278
Independent
Peter Loughman
3.9%
267
275
275
Electorate: 12,812 Valid: 7,814 (60.99%) Spoilt: 116 Quota: 977 Turnout: 7,930 (61.90%)
Emo
Luggacurren
Luggacurren- 4 seats
Party
Candidate
FPv% Count
1
2
3
4
5
6
Fianna Fáil
James Cooney *
15.9%
600
629
758
Fine Gael
John Moran
15.5%
585
661
693
843
Fianna Fáil
Martin Rohan*
15.3%
575
581
626
663
667
679
Fianna Fáil
Mary Wheatley *
13%
491
538
631
674
678
690
Fine Gael
James Daly
12.7%
478
552
575
742
822
Fianna Fáil
Mary Redmond
9.8%
368
382
Fine Gael
Senator Charles McDonald *
9.5%
358
394
431
Labour
Tony O'Brien
7.9%
299
Independent
Thomas McCormack
0.4%
16
Electorate: 5,972 Valid: 3,770 (63.13%) Spoilt: 35 Quota: 755 Turnout: 3,805 (63.71%)
Portlaoise
Portlaoise - 5 seats
Party
Candidate
FPv% Count
1
2
3
4
5
6
7
8
9
10
Fianna Fáil
Joe Dunne *
30.5%
1,316
Fine Gael
William Aird *
14.5%
625
684
685
698
741
Fine Gael
Tom Keenan *
14.5%
624
686
688
711
747
Fianna Fáil
Tom Jacob
7.3%
314
489
489
500
517
519
521
534
559
703
Fianna Fáil
Jerry Lodge *
7.1%
304
436
436
450
466
472
476
518
549
678
Progressive Democrats
Assumpta Broomfield
6.8%
292
314
314
325
338
343
346
397
464
493
Fianna Fáil
John Fitzgibbon
5.9%
254
331
331
338
341
341
342
350
373
Fine Gael
Ger O'Donoghue
4.3%
187
198
198
205
221
233
246
267
Labour
Tom Phelan
3.2%
139
151
151
178
184
186
188
Fine Gael
Anthony Dunne
3%
129
150
152
165
Independent
Joe McCormack
2.8%
120
145
149
Independent
Joseph Bannan
0.2%
8
9
Electorate: 7,588 Valid: 4,312 (56.83%) Spoilt: 24 Quota: 719 Turnout: 4,336 (57.14%)
Tinnahinch
External links

