
User:DuncanMacC/sandbox

3D images of Mandelbrot and Julia sets
[edit]In addition to creating two dimensional images of the Mandelbrot set, various techniques can be used to render Mandelbrot and Julia sets as 3D Heightmap images, where each pixel in a 2D images is given a height value, and the resulting image is rendered as a 3D graphic.
The simplest approach to 3D rendering uses the iteration value for each pixel as a height value. This produces images with distinct "steps" in the height value.

If instead you use the fractional iteration value (also known as the potential function) to calculate the height value for each point, you avoid steps in the resulting image. However, images rendered in 3D using fractional iteration data still look rather bumpy and visually noisy.

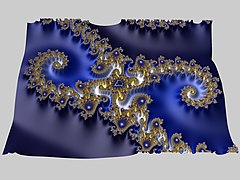
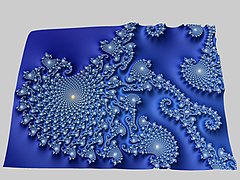
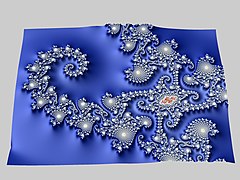
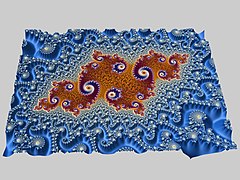
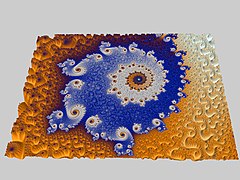
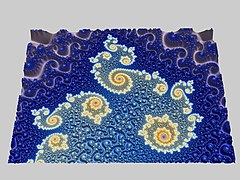
A better approach is to use Distance Estimate (DE) data for each point to calculate a height value. Non-linear mapping of distance estimate value using an exponential function can produce visually pleasing images. Images plotted using DE data are often visually striking, and more importantly, the 3D shape makes it easy to visualize the thin "tendrils" that connect points of the set.

Below is a 3D version of the "Image gallery of a zoom sequence" gallery above, rendered as height maps using Distance Estimate data, and using similar cropping and coloring.
-
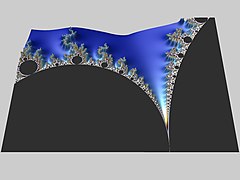
 Zoom 00. Start. Mandelbrot set with continuously colored environment.
 -
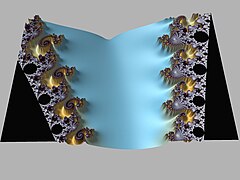
 Zoom 01. Gap between the "head" and the "body", also called the "seahorse valley"
 -
 Zoom 02. Double-spirals on the left, "seahorses" on the right
 -
 Zoom 03. "Seahorse" upside down


-
 Zoom 04. A "seahorse tail".
 -
 Zoom 05. Part of the "tail".
 -
 Zoom 06. Satellite with twin "Seahorse tails."
 -
 Zoom 07. Satellite closeup.
 -
 Zoom 08. "Antenna" of the satellite. Several satellites of second order may be recognized.
 -
 Zoom 09. The "seahorse valley" of the satellite. All the structures from the start of the zoom reappear.
 -
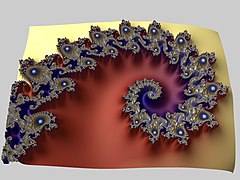
 Zoom 10. Double-spirals and "seahorses"
 -
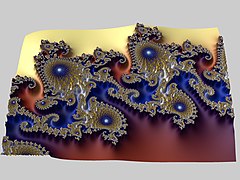
 Zoom 11. Double-spirals with satellites of second order.
 -
-
 Zoom 13. Part of the "double-hook"
 -
 Zoom 14. Islands
 -
 Zoom 15. Detail of one island
 -
 Zoom 16. Detail of the spiral.


