From Wikipedia, the free encyclopedia
Westmeath County Council election, 2014
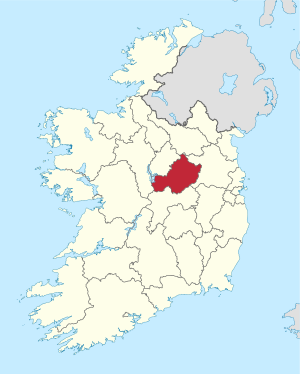
Map showing the area of Westmeath County Council
Council control after election TBD
An election to Westmeath County Council took place on 23 May 2014 as part of that year's Irish local elections . 20 councillors were elected from three electoral divisions by PR-STV voting for a five-year term of office, a reduction of 3 seats compared to 2009. In addition Athlone Town Council and Mullingar Town Council were both abolished.
Fianna Fáil emerged as the largest party after the elections as both Government parties suffered at the polls. Labour lost 2 thirds of her Councillors being reduced to just 2 seats while Fine Gael also lost 3 seats. Sinn Féin won seats on the Council for the first time, 3 in total, and were joined by 2 Independents.[ 1] [ 2]
Results by party
style="width: 2px; color:inherit; background-color: #66BB66;" data-sort-value="Fianna Fáil" |
style="width: 2px; color:inherit; background-color: #6699FF;" data-sort-value="Fine Gael" |
style="width: 2px; color:inherit; background-color: #326760;" data-sort-value="Sinn Féin" |
style="width: 2px; color:inherit; background-color: #CC0000;" data-sort-value="Labour Party (Ireland)" |
style="width: 2px; color:inherit; background-color: #DCDCDC;" data-sort-value="Independent (politician)" |
Results by Electoral Area
Athlone
Athlone - 7 seats
Party
Candidate
FPv% Count
1
2
3
4
5
6
7
8
9
Independent
Kevin (Boxer) Moran 21.78
2,897
Fine Gael
Tom Farrell
11.29
1,502
1,552
1,561
1,594
1,616
1,648
1,649
1,724
Sinn Féin
Paul Hogan
10.70
1,423
1,684
Fine Gael
John Dolan *
8.16
1,085
1,139
1,146
1,161
1,193
1,239
1,240
1,345
1,681
Fianna Fáil
Aengus O'Rourke
7.88
1,048
1,256
1,267
1,306
1,357
1,387
1,392
1,494
1,636
Fianna Fáil
Frankie Keena *
7.77
1,034
1,200
1,213
1,255
1,317
1,373
1,377
1,520
1,648
Fianna Fáil
Vinny McCormack
7.27
967
983
985
991
1,001
1,010
1,010
1,080
1,088
Independent
Michael O'Brien
6.85
911
1,001
1,054
1,084
1,113
1,203
1,208
1,354
1,418
Fine Gael
Alan Shaw
5.43
722
817
829
838
883
899
902
911
Fianna Fáil
Tom Allen *
4.86
647
674
684
716
733
767
769
Labour
Jim Henson
2.37
315
388
410
428
Independent
Joe Devery
2.35
313
394
429
476
527
Independent
P.J. Coghill
2.08
277
312
333
Independent
John McNamara
0.90
120
171
Independent
Donal Jackson
0.31
41
68
Electorate: 22,759 Valid: 13,302 (52.60%) Spoilt: 157 Quota: 1,663 Turnout: 13,459 (53.22%)
Mullingar-Coole
Mullingar-Coole - 7 seats
Party
Candidate
FPv% Count
1
2
3
4
5
6
7
8
Fianna Fáil
Aidan Davitt 12.90
1,492
Sinn Féin
Una D'arcy
12.86
1,487
Fianna Fáil
John Shaw *
11.02
1,275
1,287
1,290
1,307
1,331
1,404
1,588
Fianna Fáil
Paddy Hill *
10.44
1,207
1,215
1,220
1,241
1,308
1,326
1,342
1,357
Fine Gael
Frank McDermott *
10.06
1,163
1,164
1,167
1,195
1,249
1,372
1,414
1,428
Fine Gael
Peter Burke 8.72
1,008
1,015
1,017
1,031
1,135
1,391
1,534
Labour
Mick Dollard *
8.21
950
956
960
992
1,025
1,062
1,268
1,312
Labour
Denis Leonard*
6.24
722
723
724
749
835
895
Independent
Brian Fagan
5.86
678
684
695
849
888
951
1,057
1,078
Fine Gael
Emily Wallace
5.42
627
630
631
660
731
Labour
Peter Kearney
4.50
520
521
522
563
563
Labour
Rachel Grimes
1.47
170
170
172
172
Independent
Angela Maher
1.23
142
143
146
146
Independent
Pat Holmes
0.72
83
83
86
86
Independent
Rosemary Horan
0.36
42
42
44
44
Electorate: 22,759 Valid: 11,566 (50.82%) Spoilt: 205 Quota: 1,446 Turnout: 11,771 (51.72%)
Mullingar-Kilbeggan
Mullingar-Kilbeggan - 6 seats
Party
Candidate
FPv% Count
1
2
3
4
5
6
7
8
9
10
Fianna Fáil
Paul Daly 15.25
1,502
Fianna Fáil
Avril Whitney *†††††
12.86
1,266
1,277
1,288
1,295
1,348
1,376
1,405
1,428
Fianna Fáil
Ken Glynn *
9.89
974
992
1,011
1,023
1,058
1,068
1,114
1,133
1,138
1,207
Labour
Johnnie Penrose *
9.58
943
952
968
1,029
1,083
1,169
1,369
1,488
Sinn Féin
Sorca Clarke
9.41
927
932
962
976
987
1,022
1,048
1,073
1,075
1,154
Fine Gael
Andrew Duncan
8.04
792
797
805
827
909
937
999
1,144
1,165
1,432
Fine Gael
Colm Arthur*
6.05
596
603
609
637
660
669
696
834
857
Independent
Brian Fagan
5.93
584
587
733
744
765
793
876
891
903
974
Fine Gael
Michael Newman
4.78
471
487
489
569
622
635
653
653
Labour
Detty Cornally*
4.77
470
471
485
516
535
587
587
Labour
Gerry Sheridan
3.87
381
382
390
398
401
401
Fine Gael
Chris Murtagh
3.49
344
344
350
354
Labour
Ger Corcoran*
3.00
295
312
312
Independent
Chris Burley
1.65
162
163
Independent
Angela Maher
1.43
141
142
Electorate: 20,021 Valid: 9,848 (49.19%) Spoilt: 161 Quota: 1,407 Turnout: 10,009 (49.99%)
References
Changes since 2014
† Athlone Independent Cllr Kevin (Boxer) Moran was elected as a TD for Longford-Westmeath at the Irish general election, 2016. Ailish McManus was co-opted to fill the vacancy on 21 March 2016.[1]
†† Mullingar-Coole Fine Gael Cllr Peter Burke was elected as TD for Longford-Westmeath at the Irish general election, 2016. Emily Wallace was co-opted to fill the vacancy on 21 March 2016.[2]
††† Mullingar-Coole Fianna Fáil Cllr Aidan Davitt was elected to Seanad Éireann in April 2016. Bill Collentine was co-opted to fill the vacancy on 13 June 2016.[3]
†††† Mullingar-Kilbeggan Fianna Fáil Cllr Paul Daly was elected to Seanad Éireann in April 2016. Liam McDaniel was co-opted to fill the vacancy on 13 June 2016.[4]
††††† Mullingar-Kilbeggan Fianna Fáil Cllr Avril Whitney resigned her seat for personal reasons on 31 May 2017.[5]
External links

