
Sutter, California
Sutter
South Butte, Sutter City | |
|---|---|
 Location in Sutter County and the state of California | |
| Coordinates: 39°9′44″N 121°44′59″W / 39.16222°N 121.74972°W | |
| Country | |
| State | |
| County | Sutter |
| South Butte | August 7, 1871 |
| Sutter City | January 20, 1888 |
| Sutter | January 26, 1895 |
| Area | |
| • Total | 3.036 sq mi (7.862 km2) |
| • Land | 3.036 sq mi (7.862 km2) |
| • Water | 0 sq mi (0 km2) 0% |
| Elevation | 75 ft (23 m) |
| Population | |
| • Total | 2,997 |
| • Density | 990/sq mi (380/km2) |
| Time zone | UTC-8 (Pacific (PST)) |
| • Summer (DST) | UTC-7 (PDT) |
| ZIP code | 95982 |
| Area code | 530 |
| FIPS code | 06-77378 |
| GNIS feature ID | 0255919 |
Sutter, formerly South Butte and Sutter City, is a census-designated place (CDP) in Sutter County, California, United States. It is part of the Yuba City Metropolitan Statistical Area within the Greater Sacramento CSA. The population as of the 2010 census was 2,904, up from 2,885 at the 2000 census.
History[edit]
Originally a settlement called South Butte, established in the vicinity of the stage station at Butte House east of the current town. It had a post office from August 7, 1871, until December 17, 1878, and from February 18, 1879, to January 20, 1888, when it was moved to the new Sutter City Post Office nearby. The Sutter Cemetery originally South Butte Cemetery, lay to the west on the stage road, and beside it was the school house, that was dismissed when there was a funeral.[3]
Sutter City was the result of an attempt to take advantage of the boom in California in the late 1880s. The town was located south of the Cemetery along the path of a railroad line projected to pass through the town and it hoped to become the new county seat, because it was near the geographical center of the county. However the rail line was never built and it never became the county seat.[4]
The Sutter City post office name was changed to Sutter on January 26, 1895.[5]
Geography[edit]
According to the United States Census Bureau, the CDP covers an area of 3.0 square miles (7.9 km2), all of it land.
Demographics[edit]
2010[edit]
The 2010 United States Census[6] reported that Sutter had a population of 2,904. The population density was 956.7 inhabitants per square mile (369.4/km2). The racial makeup of Sutter was 2,503 (86.2%) White, (0.6%) African American, (0.9%) Native American, 30 (1.0%) Asian, 1 (0.0%) Pacific Islander, 160 (5.5%) from other races, and 140 (4.8%) from two or more races. Hispanic or Latino of any race were 410 persons (14.1%).
The Census reported that 2,904 people (100% of the population) lived in households, 0 (0%) lived in non-institutionalized group quarters, and 0 (0%) were institutionalized.
There were 1,021 households, out of which 428 (41.9%) had children under the age of 18 living in them, 605 (59.3%) were opposite-sex married couples living together, 127 (12.4%) had a female householder with no husband present, 68 (6.7%) had a male householder with no wife present. There were 53 (5.2%) unmarried opposite-sex partnerships, and 7 (0.7%) same-sex married couples or partnerships. 177 households (17.3%) were made up of individuals, and 92 (9.0%) had someone living alone who was 65 years of age or older. The average household size was 2.84. There were 800 families (78.4% of all households); the average family size was 3.18.
The population was spread out, with 791 people (27.2%) under the age of 18, 255 people (8.8%) aged 18 to 24, 652 people (22.5%) aged 25 to 44, 856 people (29.5%) aged 45 to 64, and 350 people (12.1%) who were 65 years of age or older. The median age was 39.1 years. For every 100 females, there were 105.1 males. For every 100 females age 18 and over, there were 102.0 males.
There were 1,082 housing units at an average density of 356.4 per square mile (137.6/km2), of which 777 (76.1%) were owner-occupied, and 244 (23.9%) were occupied by renters. The homeowner vacancy rate was 2.1%; the rental vacancy rate was 3.9%. 2,198 people (75.7% of the population) lived in owner-occupied housing units and 706 people (24.3%) lived in rental housing units.
2000[edit]
As of the census[7] of 2000, there were 2,885 people, 922 households, and 771 families residing in the CDP. The population density was 951.8 inhabitants per square mile (367.5/km2). There were 952 housing units at an average density of 314.1 per square mile (121.3/km2). The racial makeup of the CDP was 84.85% White, 0.28% African American, 2.53% Native American, 0.66% Asian, 6.27% from other races, and 5.41% from two or more races. Hispanic or Latino of any race were 12.41% of the population.
There were 922 households, out of which 47.5% had children under the age of 18 living with them, 65.4% were married couples living together, 12.6% had a female householder with no husband present, and 16.3% were non-families. 12.4% of all households were made up of individuals, and 5.9% had someone living alone who was 65 years of age or older. The average household size was 3.13 and the average family size was 3.38.
In the CDP, the population was spread out, with 34.5% under the age of 18, 7.5% from 18 to 24, 28.8% from 25 to 44, 20.1% from 45 to 64, and 9.1% who were 65 years of age or older. The median age was 33 years. For every 100 females, there were 101.5 males. For every 100 females age 18 and over, there were 93.4 males.
The median income for a household in the CDP was $41,296, and the median income for a family was $78,677. Males had a median income of $35,577 versus $22,583 for females. The per capita income for the CDP was $16,509. About 10.1% of families and 12.2% of the population were below the poverty line, including 15.9% of those under age 18 and 3.6% of those age 65 or over.
Media[edit]
MySYtv.com provides television coverage of local events in the area.
Politics[edit]
In the state legislature, Sutter is in the 4th Senate District, represented by Republican Jim Nielsen, and in the 3rd California State Assembly District, represented by Republican James Gallagher.
Federally, Sutter is in California's 3rd congressional district, represented by Republican Kevin Kiley.[8]
References[edit]
- ^ U.S. Census Archived 2012-01-25 at the Wayback Machine
- ^ "Explore Census Data". data.census.gov. Retrieved June 22, 2023.
- ^ Nancy Capace, Encyclopedia of California, Somerset Publishers, Incorporated, North American Book Dist. LLC, Jun. 1, 1999, p. 448.
- ^ A Memorial and Biographical History of Northern California: Containing a History of this Important Section of the Pacific Coast from the Earliest Period of Its Occupancy to the Present Time, Lewis Publishing Company, Chicago, 1891, p. 266.
- ^ Walter N. Frickstad, A Century of California Post Offices 1848-1954, Philatelic Research Society, Oakland, CA. 1955, pp 193-203.
- ^ "2010 Census Interactive Population Search: CA - Sutter CDP". U.S. Census Bureau. Archived from the original on July 15, 2014. Retrieved July 12, 2014.
- ^ "U.S. Census website". United States Census Bureau. Retrieved January 31, 2008.
- ^ "California's 3rd Congressional District - Representatives & District Map". Civic Impulse, LLC. Retrieved March 1, 2013.
External links[edit]
Municipalities and communities of Sutter County, California, United States | ||
|---|---|---|
| Cities | 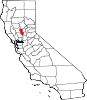 | |
| CDPs | ||
| Unincorporated communities | ||
| International | |
|---|---|
| National | |
| Other | |