
Wikipedia talk:Requests for mediation/Solar energy
Discussion[edit]
So I would like the parties to to add below what picture they think should at the top of the article and why. We'll deal with this issue first and then address the issue of the navbox in general. Try to cite policy where possible, and what makes the image you prefer, unique and superior to other images. Please do not comment in other users' sections, we will have discussion after this part of the mediation. Thank you. MBisanz talk 22:29, 1 July 2008 (UTC)
Statement by Itsmejudith (talk · contribs)[edit]
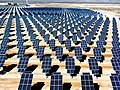
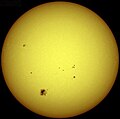
| Hi. I'm Itsmejudith (talk). I like the picture of the Sun very much and think it opens the article with the right tone. I also like the picture of the Nellis power station and think it could probably be used in the section on solar electricity, although we already have the picture of the Space Station and one of building-integrated PV, and we don't want to over-illustrate. I don't think the cubes picture is any use to us. I appreciate that it has been designed to get across a certain point about the potential of solar energy, but in the end it is just too complex for the point it is trying to make. It raises more questions than answers: a) about the definition of solar energy (does it include wind and hydro-electric?) and b) about "potential" (potentially usable next year or in fifty years' time?). I quite like the picture of insolation around the world, but what the dots are meant to represent could be rather difficult to interpret for a reader completely unfamiliar with energy policy. I really hope we can resolve this quickly and get the article to FA. Itsmejudith (talk) 22:44, 1 July 2008 (UTC) |
| I agree with Itsmejudith. Solar energy is well described by a picture of the Sun and this particular picture is pleasing. I find the box picture unprofessional and aesthetically inferior. Many people have raised issues with the diagram along the lines of those detailed in How to Lie with Statistics which warns against using three dimensional figures to compare quantities. The other problem is that the numbers used in the box diagram conflict with numbers used elsewhere on the page. Finally, I don't want to see this picture migrate from the lead onto another area of the page either. Mrshaba (talk) 03:08, 2 July 2008 (UTC) |
| It's just a no brainer that the lead image should illustrate the article. This is the solar energy article, and the lead image should be an application of solar energy. Today photovoltaics are an exciting development in the energy field, and is the fastest growing energy source in the world today, doubling every two years. While many discount photovoltaics as expensive and unimportant because less than half of a percent of electricity is generated from photovoltaics, they are overlooking two important facts, one, the power of compound interest - doubling every two years takes you from half a percent to eighty percent in only fifteen years, and two, the cost of using fossil fuel and nuclear is astronomical in terms of both physical and social costs. There aren't many on the planet (outside of Iran and Syria) who are thrilled with the idea of Iran or Syria developing nuclear power. So the question comes up, if the world is running out of oil, what can replace it? The answer is clearly evident in the "box diagram" (not navbox, but Image:Available Energy-3.png), which is solar energy, wind energy, and geothermal. For all of the above reasons the most obvious lead image is an image of a large solar farm, preferably of one of the new 20 MW solar parks in Spain, or of the much larger solar power plants under construction in Portugal and Australia. An alternative would be one of the large solar thermal power plants such as the Image:Solar two.jpg that we used in the lead for quite a while. There are requests for building 24,000 MW of solar plants in Southern California, mostly solar thermal. California has a requirement that 20% of electricity come from renewable sources by 2017, and California on average uses about 32,000 MW of electricity. Since solar plants have a "duty cycle" of about 20%, 24,000 MW of solar plants would produce on average about 4,800 MW, or about 15% of demand, which would account for 3/4 of the 20% requirement. In 50 years there won't be any fossil fuel or nuclear left, and we will need to get all of our electricity from renewable sources (n.b. if there were no renewables available exotic nuclear technologies could be developed to take their place, but they just aren't needed, and would be plain stupidity to use, given the ample availability of renewables). There is room for two images in the lead (you can see that there isn't room for three, especially if one is so tall), and I firmly believe that the first should show an application of solar energy (after all that is the title of the article), and the other should be an image that demonstrates the potential of solar energy, either the "box diagram", or the "dot diagram". I personally prefer swapping the box diagram with the dot diagram, so that the box diagram is next to the paragraph about the potential of solar energy. I believe that that is where it was originally, before things got switched around. |
Discussion[edit]
Thanks for all being so quick to respond, it makes the process flow well when we all can communicate at a steady rate. Apteva has linked to some images, and Itsmejudith and mrshaba have referenced some. So to start the discussion, I'd like everyone to place 200px thumbnails of the images they think should be in the lead in the section below. Also, I notice that at the moment we do not have an infobox at the top of the page, could someone indicate if this is normal for this type of article or if the type of infobox is also in dispute. Thanks. MBisanz talk 08:18, 2 July 2008 (UTC)
Gallery[edit]
-
-
![Solar energy reaching the earth's surface (left) greatly exceeds both total wind energy (center) and global energy consumption (right), although only a small portion of each is recoverable.[1]](//upload.wikimedia.org/wikipedia/commons/thumb/1/1d/Available_Energy-3.png/120px-Available_Energy-3.png) Solar energy reaching the earth's surface (left) greatly exceeds both total wind energy (center) and global energy consumption (right), although only a small portion of each is recoverable.[1]
Solar energy reaching the earth's surface (left) greatly exceeds both total wind energy (center) and global energy consumption (right), although only a small portion of each is recoverable.[1] -
 Average insolation showing land area (small black dots) required to replace the total world energy supply with solar electricity
 -
 11 MW Serpa solar power plant in Portugal
 -
 Sun
Sun -
 Wider view
 -
 Full view
 -
 Alternate full view
 -
 The Solar Two 10 MW solar power facility, showing the power tower (left) surrounded by the sun-tracking mirrors.


No infobox has been created for solar energy. If one was it would displace the navlinks and the second image. I would actually prefer to swap the second and third images above in their location in the article, and replace the first image with a currently non-existent one from one of the larger solar parks. Currently the largest solar park from Europe that we have an image of is the fourth image above. Apteva (talk) 10:50, 2 July 2008 (UTC)
There isn't a simple one size fits all way to compare energy technologies so they do not lend themselves to the use of infoboxes. The Sun picture is the one I suggest for the lead because I think introduces the subject in a visually stimulating way. I think pictures of the various technologies are better left to the part of the article in which they are covered. Mrshaba (talk) 00:36, 3 July 2008 (UTC)
- Do we have all the pictures yet, or are we still missing a couple? MBisanz talk 09:33, 7 July 2008 (UTC)
- Ok, so we have some images to work on, I went looking around similar articles that are featured, and found a couple that might be a good reference point for the discussion:
I'm wondering if we could get some conversation going on what style of image is appropriate for a Wikipedia:Lead section based on other articles and on what a reader would expect from this article. MBisanz talk 18:27, 7 July 2008 (UTC)
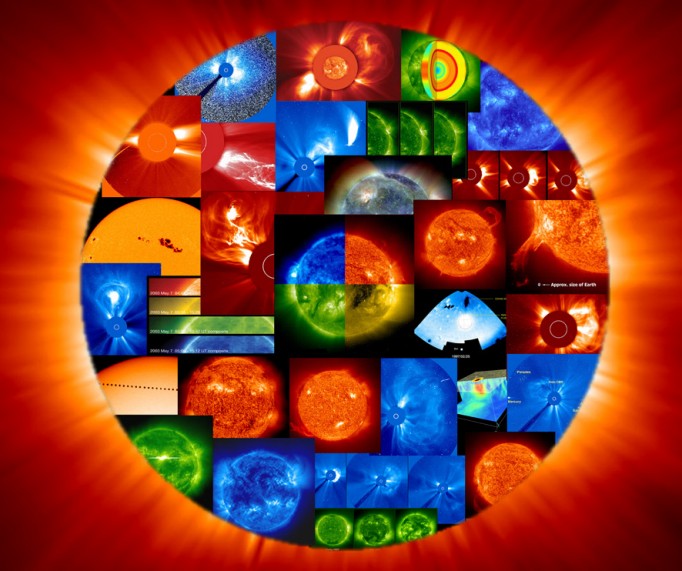
- A strong majority of solar energy and renewable energy organizations represent themselves with a Sun icon of some sort. The list includes ISES (the oldest and largest), ASES, RMI, NREL, DOE, SEIA, SEI, ACORE, PSA and SEL. Most PV companies incorporate an abstract Sun icon of some sort: BP Solar, SunPower, Nanosolar, First Solar, SolarWorld and Canadian Solar; concentrating solar companies: eSolar, Sky Fuel; and solar water heating companies: [1] This makes sense because solar technologies are all named after the Sun. I'd eventually like to get this page up to FA status and ideally it should have an FA quality picture for its lead. I think the Sun picture above is a potential FA candidate (I'll nominate it and see) and I also like the TRACE image that is already FA. The other issue here is getting the box picture off the page. There is no sense solving the lead picture problem and not addressing the box picture issue. Everyone in the references above has argued against the box picture going back over a year and I would like to solve this issue once and for all. Mrshaba (talk) 23:23, 7 July 2008 (UTC)
Getting back to the question, all of the images other than the image of the earth in Planetary habitability (which does not indicate any sign of habitability) are good illustrations of the subject of each article, which is the main point I have been making, although I would prefer a closer up image of a beach in the RE in Scotland article. It previously used this image, which showed the waves but not wind. The current image shows wind energy but not waves close up. It is very often very hard to find good images that can be used. I'm glad that you included RE in S, as it is currently surprisingly the only FA in the entire energy field, even though there are many thousands of energy related articles. It reached FA status after only 202 edits, made primarily by only two editors, one who edits a lot of energy articles, the other only that one. Solar energy has had over 5,000 edits. The energy portal, however is a featured portal, mostly due to the efforts of the same editor who assisted with the RE in S article. So to answer your question, what would a reader expect for the lead image of this article, I would expect an image that illustrated the subject of the article. FA image stature simply indicates an image that makes you say wow, that's an amazing image, and is definitely as far as you can get from a requirement for the lead image of an FA article. Apteva (talk) 03:37, 8 July 2008 (UTC)
- As you can see, that "full image" is not the original. However, it should have been cropped from the bottom up, instead of just cropping out the robot arm (the subject of the original photograph), so that the aspect ratio was more similar to the solar two image. By the way, I'm sure that NASA has a million photos of the sun rising over the earth that are a lot more interesting than this one. I see that there is no support for it being a FA image, but as I said before, FA image status and FA article have nothing to do with each other. You do realize that it isn't even obvious that that is the sun - it could be just a flash burst from an astronaut taking a photo. By the way, I can't believe you actually "photo-shopped" it with MS Paint - you do know that Photoshop is a real program? Apteva (talk) 18:26, 8 July 2008 (UTC)
- All the articles cited use images in different ways, but a theme you can find in all of them is that they start off with a quite general illustration and then use more specific ones for sub-topics. I think we can do that by using the Sun image in first place. We are actually extremely lucky, luckier than editors in those other articles, in that we have a plethora of great images to choose from. We are spoilt for choice and most of our potential choices are uncontroversial. Would it be possible now to go through each image listed above and participants here comment on the reason why they think it is a useful addition to the article? Itsmejudith (talk) 14:47, 10 July 2008 (UTC)
- Sounds like a good idea, also we all might take a gander at commons:Category:Solar energy and commons:Category:Sun to see if there are any other images worth considering. MBisanz talk 14:50, 10 July 2008 (UTC)
- I removed the extra images because they are not relevant to the discussion. Taking the images in order, the Nellis image is useful because it is the largest photovoltaic park that we have a photograph of, and photovoltaics are the most exciting aspect of solar energy today. The "box" image is a good illustration of the potential of solar energy, along with the remaining renewables, wind and geothermal. The "dot" image is also a good illustration of the potential of solar energy, sort of from the opposite point of view (not how much is there, but how much land is needed). Both of these are essential to the article, and one but not both should be the second image in the lead. The other image of a solar farm is good because it is the largest photovoltaic farm in Europe that we have an image of, in order to try to geo-diversify the article - and not make it US-centric. The sun image is not useful because it doesn't illustrate the subject of the article. The solar two image is excellent because even though it has oddly now been de-commissioned, it is an iconic image of solar power, and for really large solar power stations it is thought that solar troughs, like SEGS and solar towers, like solar two, with a preference for solar troughs, is the way to go. For smaller, backyard, rooftop netmetering applications, photovoltaics wins hands down. We can expect a lot of those - many new homes are coming with them now, and they are eminently practical. To get an idea of the growth of photovoltaics, see Image:Solarstromverbrauch brutto Deutschland.png. I too have looked through a lot of the commons images in the cat previously. As to other sun images - wrong article. Image:End view of Kramer Junction solar field.jpg isn't too bad, but I would greatly prefer something like solar two or a photovoltaic power plant. Apteva (talk) 03:39, 11 July 2008 (UTC)
- I appreciate your good faith contribution to the discussion and your clear statement of your views. We are now coming nearer to the heart of the disagreement. The purpose of this article is not to promote solar energy. And it is definitely not to promote certain forms of solar energy as more important than others. "Photovoltaics are the most exciting aspect of solar energy today" is simply your point of view. Someone could equally argue for more prominence for solar thermal, which is growing fast and involves more people. When I first came to this article it was a terrible mess because it mixed up PV and solar thermal throughout. It was like that as a result of people POV-pushing both sides of the PV economics debate with no concern for comprehensive coverage or readability. It has taken a lot of time and effort to disentangle it all, but now the article is properly structured. Therefore images can illustrate one section/subsection at a time. I like the Nellis picture too and it could go into the PV section. My argument against "box" is that it is designed to make a point, and one that would be better made in writing and appropriately sourced. The image is virtually impossible to make sense of unless enlarged beyond what looks attractive in the article; there is also the "lying with statistics" consideration. The insolation with dots, again it is a rather laborious way to make a point. Readers will only look at the insolation and their reading of the article could be held up on trying to make sense of what the dots represent. The "box" and "dots" images might be OK in a textbook where there would be more room to display them, more word-length available to explain how to read them, and more demand can be made on the reader. In this article we just give an overview of what solar energy is and provide links to subarticles and sources for those who want to read more. I am also interested to know if there is any conflict of interest in the images we are proposing. Can I ask you Apteva whether you have any connection with the creator(s) of the box and dots images? Our mediator should bear in mind that we are all three of us fairly close to the topic. I believe that Mrshaba works in the energy industry in some capacity. I am a PV enthusiast with one of the "smaller backyard net metering" installations that Apteva mentions. And I think Apteva also has a connection with the field, but I am not sure what. We all three ought to be able to put our own opinions aside and just concentrate on giving this important and informative article its final polish before FA. Itsmejudith (talk) 14:53, 11 July 2008 (UTC)
- It would not be easy to define my connection with solar energy, but it is easy to define my involvement with Wikipedia, which is to fix things that are broken, mostly vandal repair and other recent changes patrolling. I think you are reading more into my comment than is there. Any important development needs to be added to each WP article. If this was an article about making clothing and someone came up with the zipper instead of buttons should it be added to the article? That's what photovoltaics are to solar energy, a new way using solar energy. Yes it's exciting, but I'm not putting it into the article because I'm advocating photovoltaics, I'm putting it in because it is important to the article. One of the most basic questions about solar energy today, is, "Can it be used as a replacement for coal, oil and natural gas, all of which are in trouble?" A picture is worth a thousand words, and it is much more useful to answer this very basic question with both the box and dot diagrams. I would love to have every article achieve FA status, but this one is a long ways from that, mostly because most of Mrshaba's efforts are highly counterproductive. For a while I figured that since he worked for a nuclear plant he was paid to f-up the article. I now believe that he just is clueless. There are many articles that are similarly guarded by well meaning but equally clueless SPA's who drive away rather than attract collaborative editing. Apteva (talk) 05:52, 12 July 2008 (UTC)
- My, that incivility was uncalled-for. Did you ever see the article before Mrshaba arrived. It was a complete mess. He has put in masses of effort, found loads of good references. When I have thought there was any problem I have explained and he listened. I supported you rather than him on the change of title from solar power to solar energy but we remained on good terms throughout. Now, to your point. I agree that an important question about solar is "can it be used as a replacement for coal, oil and natural gas?". I also believe the answer is "yes". As I said, I am a PV enthusiast. We can only add that to the article if we have a good source that says it. A picture is not always worth a thousand words. Both the diagrams are difficult to interpret. I have seen on other articles attempts to POV-push by choice of images and it is very counterproductive. Itsmejudith (talk) 20:22, 12 July 2008 (UTC)
- It would not be easy to define my connection with solar energy, but it is easy to define my involvement with Wikipedia, which is to fix things that are broken, mostly vandal repair and other recent changes patrolling. I think you are reading more into my comment than is there. Any important development needs to be added to each WP article. If this was an article about making clothing and someone came up with the zipper instead of buttons should it be added to the article? That's what photovoltaics are to solar energy, a new way using solar energy. Yes it's exciting, but I'm not putting it into the article because I'm advocating photovoltaics, I'm putting it in because it is important to the article. One of the most basic questions about solar energy today, is, "Can it be used as a replacement for coal, oil and natural gas, all of which are in trouble?" A picture is worth a thousand words, and it is much more useful to answer this very basic question with both the box and dot diagrams. I would love to have every article achieve FA status, but this one is a long ways from that, mostly because most of Mrshaba's efforts are highly counterproductive. For a while I figured that since he worked for a nuclear plant he was paid to f-up the article. I now believe that he just is clueless. There are many articles that are similarly guarded by well meaning but equally clueless SPA's who drive away rather than attract collaborative editing. Apteva (talk) 05:52, 12 July 2008 (UTC)
- I appreciate your good faith contribution to the discussion and your clear statement of your views. We are now coming nearer to the heart of the disagreement. The purpose of this article is not to promote solar energy. And it is definitely not to promote certain forms of solar energy as more important than others. "Photovoltaics are the most exciting aspect of solar energy today" is simply your point of view. Someone could equally argue for more prominence for solar thermal, which is growing fast and involves more people. When I first came to this article it was a terrible mess because it mixed up PV and solar thermal throughout. It was like that as a result of people POV-pushing both sides of the PV economics debate with no concern for comprehensive coverage or readability. It has taken a lot of time and effort to disentangle it all, but now the article is properly structured. Therefore images can illustrate one section/subsection at a time. I like the Nellis picture too and it could go into the PV section. My argument against "box" is that it is designed to make a point, and one that would be better made in writing and appropriately sourced. The image is virtually impossible to make sense of unless enlarged beyond what looks attractive in the article; there is also the "lying with statistics" consideration. The insolation with dots, again it is a rather laborious way to make a point. Readers will only look at the insolation and their reading of the article could be held up on trying to make sense of what the dots represent. The "box" and "dots" images might be OK in a textbook where there would be more room to display them, more word-length available to explain how to read them, and more demand can be made on the reader. In this article we just give an overview of what solar energy is and provide links to subarticles and sources for those who want to read more. I am also interested to know if there is any conflict of interest in the images we are proposing. Can I ask you Apteva whether you have any connection with the creator(s) of the box and dots images? Our mediator should bear in mind that we are all three of us fairly close to the topic. I believe that Mrshaba works in the energy industry in some capacity. I am a PV enthusiast with one of the "smaller backyard net metering" installations that Apteva mentions. And I think Apteva also has a connection with the field, but I am not sure what. We all three ought to be able to put our own opinions aside and just concentrate on giving this important and informative article its final polish before FA. Itsmejudith (talk) 14:53, 11 July 2008 (UTC)
Additional sun pictures[edit]
-
 Heat and light from the Sun
 -
 The original
 -
 Another flare
 -
 Sun in X-Ray
 -
 Orange Sun


Solar = Sun... I think the page should start off with a provocative image of the Sun. The box picture is visually bland and misleading and I think it dissuades readers from continuing on with the page. I've stated this repeatedly, the RFC came to this conclusion and everyone who has commented has said something similar. As far as the dot image goes, I've asked Matthias to modify it but its current manifestation seems to have found a home in the Energy from the Sun section. The other application based photos can go in the appropriate sections. Which of the versions of the Sunburst picture is the best? Mrshaba (talk) 22:07, 11 July 2008 (UTC)
- None. Solar does not equal sun. Solar energy is an application that uses the energy from the sun. Showing a photo of the sun is not useful to the article. The dot image should be swapped with the box image, and used in the lead, after an image of one of the larger facilities such as solar two or one of the large photovoltaic farms, with the box image used in the energy from the sun section. Why would you want to modify the dot image? What's wrong with it? Apteva (talk) 05:52, 12 July 2008 (UTC)
Ok, so I've been reviewing the images and have a suggestion, a merged image, basically, taking some images like Image:Solar two.jpg, Image:Sun in X-Ray.png, Image:Giant photovoltaic array.jpg, Image:Solar land area.png, [:Image:Full Sunburst over Earth.JPG]], and Image:End view of Kramer Junction solar field.jpg and merging them into a single image. This approach worked rather well in Iraq War and it seems that there are many aspects to solar energy that need explaining (the big round thing in the sky, what it does on earth, how humans use it, etc).
- I don't like collages at all - they are very confusing to understand. Apteva (talk) 18:26, 12 July 2008 (UTC)
I also like Image:Available Energy-3.png as a picture. it conveys a clear scientific message about solar energy. But I have two questions/concerns.
1. Is it just my monitor or is it hard to see the text labels when the image is shrunk down to the size it would be used in the article?
- I can read it at 180px but then again I have clicked on it and know what the legends are. It looks best at about 260px. Apteva (talk) 18:26, 12 July 2008 (UTC)
2. Would people, just beginning to read the article, understand the various technical points of the image, like the "TW" acronym, the quantity of engergy represented by the blocks, or the relationship of that energey to man's use of solar energy.
- That's why it is better located next to the paragraph on energy from the sun, and use the dot image in the lead.Apteva (talk) 18:26, 12 July 2008 (UTC)
If Image:Solar land area.png were merged into a composite image (since most people IMO would associate a map of the world with colored bars as relating to solar energy, the box graph might make a good section image where Solar Land is right now.
- I started to say that Wikipedia does not have imagemaps, but I see that they do exist. I'm not sure what you had in mind, though. Apteva (talk) 18:26, 12 July 2008 (UTC)
Am I reading things right and is any of this sounding like a direction worth moving in? MBisanz talk 17:26, 12 July 2008 (UTC)
- Yes a collage could solve the problem of too many images. A collage of PV installations could work for the PV section. Itsmejudith (talk) 20:25, 12 July 2008 (UTC)
- After coming across this image I worked on some collages but haven't had much luck producing anything attractive. Here's a striking picture of the Sun with an energy theme that has potential for the lead. [2] Getting this picture would require Mr. Orman's permission but this seems possible. As I've said above I don't think the box picture belongs on the page. Many people have brought up issues with the picture and the consensus has been to remove the picture. The numbers in the picture conflict with other sourced information elsewhere on the page and they are presented in a way that skews the comparison. i.e. Volumes should not be used to compare numbers. There are also higher quality pictures that can be used instead. Again, there has been a clear consensus of opposition against this picture. Please see the RFC and other resolution steps I've taken. Mrshaba (talk) 21:34, 13 July 2008 (UTC)
- Clearly we are going off on a tangent here. Can we stay focused on one thing at a time - what to use for the lead image/images in the article? Apteva (talk) 04:20, 14 July 2008 (UTC)
![[2]](http://antwrp.gsfc.nasa.gov/apod/image/0403/equinoxp1_orman.jpg)

- This is what one possible collage could look like:
- An image map would allow you to click on each portion and get the full size image of each section. I've never done an imagemap for wikipedia, but have made them for html web pages many times, so I can probably figure out how to make one. This is a full size image of the dot image so an imagemap is less important. Apteva (talk) 04:55, 14 July 2008 (UTC)
- From a technical perspective, what you propose should be rather easy to do, if we can't figure it out here, I know some people who do images better than I do them, so I could call them in for the code stuff. Now the question of whether or not you all want such a composite image. MBisanz talk 06:09, 14 July 2008 (UTC)
Another approach[edit]
Sorry if this is irrelevant to the mediation, but I have been thinking about some of the underlying reasons why we disagree about the pictures. If I am right, I think that Apteva would like the article to show that solar energy can meet all the Earth's energy needs. We do currently say that, with reference to good sources, but it should be possible to rewrite the section currently titled "Energy from the Sun". The stats about insolation and reflection could go in a first section and then a second section might be titled "potential" or similar. The dots picture could go in there and be enlarged. Although I'm proposing this, I still have some reservations in that 1) the dots picture is about solar electricity generation only, and the article is about all of solar energy, and 2) there is a deployment to grids section towards the end, which carries all the economics. But I would be pleased to hear Apteva's comments about this. Itsmejudith (talk) 10:19, 14 July 2008 (UTC)
- Hmm, some interesting ideas here, I just woke up after getting in at 3AM to begin a 2 week conference, so I may be posting slightly more infrequently (and incoherently) over these two weeks, but I would be interested to see if rebalancing content could possible help lead to agreement on an image choice. MBisanz talk 12:13, 14 July 2008 (UTC)
- The dots picture shows that we can get all of our energy from solar electricity. The 18 TW represents all forms of energy used in 2006. Efficiency is continually increasing, and it is projected that the US will use half as much energy in 2050 as in 2006 - VW is coming out with a 235 mpg car in 2010, electric cars get over 120 mpg, LED light bulbs use a tenth as much power for the same light as incandescent (I'm writing this using a 2.2 watt LED light bulb, which over its 50,000 hour lifetime is cheaper than a CFL), and in addition a lot can be said for living on a farm using sweat power, like the Amish, and using almost no energy. I understand the recent G-8 summit cost $600 million to bring 8 people together for three days, which could have been done for $10 using internet tele-conferencing, or for less than a million if it was held in an undisclosed location.
- The point is that the world does not need to use even a tenth the energy it currently does, but even if the world chooses to use ten times as much as in 2006, solar is amply available. It isn't so much that I want the article to say that as that that is what it is and so that is what the article should say - if there weren't enough rooftops available for even a fifth of our electricity, as Mrshaba has been promoting, then it should say that - if that was a limiting factor - but Mrshaba is ignoring the fact that there is nothing stopping the world from building more rooftops, and covering the entire Sahara desert with solar panels - which are, after all, made from sand, and what do most deserts have? Sand. Wikipedia, however, is not a crystal ball, and it is not the province of the article to make long term predictions. The dot diagram along with the box diagram are sufficient to show the potential. Apteva (talk) 18:33, 14 July 2008 (UTC)
- The operative words here are can and potential. Take the village, town or city that you live in. Yes, it can get all its electricity from solar, but what would happen if it decided to do so by the end of this year? What would it cost - financially and otherwise? Anyway, what matters here is not the substantive argument, not what I think or you think or Mrshaba thinks. What matters is whether we have sources that allow us to go into the argument in more detail and give a proper context to the dots diagram. Did you say in a post that this diagram has been included in scientific publications? If so, are there sections that we can use and summarise here? NB I am still opposed to the box diagram for the reason that Mrshaba gave - it takes us into "lying with statistics" territory. Not that there is any deliberate attempt to lie, far from it I'm sure, but diagrammatic presentations of data in 3D shapes are intrinsically difficult to interpret, particularly for less statistically-literate people. This article has to be accessible to a very wide audience, school children for example. (The UK school science curriculum has just been rejigged to include more coverage of the energy debate, and there are probably similar developments in other countries. Teachers will come to the article looking for leads to curriculum material.) Itsmejudith (talk) 20:09, 14 July 2008 (UTC)
- One thing at a time, please. Can we focus only on the lead image for now? This is what it might look like.[3] Apteva (talk) 20:27, 14 July 2008 (UTC)
- I appreciate your effort, but now I have seen the result I don't think it works. I still prefer the Sun picture on its own but I would prefer the insolation-with-dots image in the lead to this collage. A collage might help us out in the solar electricity section where we have more good images than we can use without "collaging". Itsmejudith (talk) 20:34, 14 July 2008 (UTC)
- One thing at a time, please. Can we focus only on the lead image for now? This is what it might look like.[3] Apteva (talk) 20:27, 14 July 2008 (UTC)
- The operative words here are can and potential. Take the village, town or city that you live in. Yes, it can get all its electricity from solar, but what would happen if it decided to do so by the end of this year? What would it cost - financially and otherwise? Anyway, what matters here is not the substantive argument, not what I think or you think or Mrshaba thinks. What matters is whether we have sources that allow us to go into the argument in more detail and give a proper context to the dots diagram. Did you say in a post that this diagram has been included in scientific publications? If so, are there sections that we can use and summarise here? NB I am still opposed to the box diagram for the reason that Mrshaba gave - it takes us into "lying with statistics" territory. Not that there is any deliberate attempt to lie, far from it I'm sure, but diagrammatic presentations of data in 3D shapes are intrinsically difficult to interpret, particularly for less statistically-literate people. This article has to be accessible to a very wide audience, school children for example. (The UK school science curriculum has just been rejigged to include more coverage of the energy debate, and there are probably similar developments in other countries. Teachers will come to the article looking for leads to curriculum material.) Itsmejudith (talk) 20:09, 14 July 2008 (UTC)
- The point is that the world does not need to use even a tenth the energy it currently does, but even if the world chooses to use ten times as much as in 2006, solar is amply available. It isn't so much that I want the article to say that as that that is what it is and so that is what the article should say - if there weren't enough rooftops available for even a fifth of our electricity, as Mrshaba has been promoting, then it should say that - if that was a limiting factor - but Mrshaba is ignoring the fact that there is nothing stopping the world from building more rooftops, and covering the entire Sahara desert with solar panels - which are, after all, made from sand, and what do most deserts have? Sand. Wikipedia, however, is not a crystal ball, and it is not the province of the article to make long term predictions. The dot diagram along with the box diagram are sufficient to show the potential. Apteva (talk) 18:33, 14 July 2008 (UTC)
I don't like collages. Period. The choices for me are that or not using the sun at all, like this.[4] Apteva (talk) 21:21, 14 July 2008 (UTC)
- I'm not that keen on them either. We need to move towards compromise. My comments on your sandbox version are 1) that two images in the lead do not work as well as one and 2) both relate to solar electricity, not to solar energy in general. I do like the SEGs photo, but, but, but... For the first picture in the lead we need something that pulls together the article as a whole. Itsmejudith (talk) 21:38, 14 July 2008 (UTC)
- About the only comments on the lead image I recall are that we should use an iconic image such as Solar Two. Electricity is a very general form of energy that can be used in many applications - even transportation. Apteva (talk) 22:11, 14 July 2008 (UTC)
- I agree that one image in the lead works better than two. I also think we should use a generic picture because solar technologies can produce heat, light, electricity and food among other things. Solar water heating has about 150 gigawatts of capacity deployed worldwide compared to 10 gigawatts for PV. Why should the lesser of the two technologies take precedence? And what about the millions of homes designed to use daylighting and the millions of people using the solar disinfection technique to provide drinking water? As Judith said, the lead needs something that pulls together the article as a whole and a Sun picture does this. Mrshaba (talk) 23:30, 14 July 2008 (UTC)
- I probably don't have to say that I disagree on both counts - the aspect ratio is wrong on the sun picture which is why it is taking up so much space - reverse the aspect ratio (like in the collage version - making it wide and short instead of narrow and tall) and there is plenty of room for two images in the lead, as shown above, in the second example, using the SEGS image and the dots image. Apteva (talk) 12:06, 15 July 2008 (UTC)
- I agree that one image in the lead works better than two. I also think we should use a generic picture because solar technologies can produce heat, light, electricity and food among other things. Solar water heating has about 150 gigawatts of capacity deployed worldwide compared to 10 gigawatts for PV. Why should the lesser of the two technologies take precedence? And what about the millions of homes designed to use daylighting and the millions of people using the solar disinfection technique to provide drinking water? As Judith said, the lead needs something that pulls together the article as a whole and a Sun picture does this. Mrshaba (talk) 23:30, 14 July 2008 (UTC)
- About the only comments on the lead image I recall are that we should use an iconic image such as Solar Two. Electricity is a very general form of energy that can be used in many applications - even transportation. Apteva (talk) 22:11, 14 July 2008 (UTC)
This doesn't seem to be working[edit]
I don't think the collage works... The ones I've tried didn't work either because a collage cannot easily portray passive solar, CSP, PV, solar hot water, SODIS, solar cooking etc. On the other hand, we have several attractive Sun images to choose from and using a Sun image avoids the issue of choosing a few technologies to represent the page. The Activation energy, Electricity, Energy, Kinetic energy, Heat, Radiant energy, and Chemistry pages offer good examples of using an attractive image for the lead picture. Again, a Sun image can be used to generically represent solar resources and solar technologies in a visually stimulating way. Solar = Sun... This should be easy.
Pardon me MBisanz but this process seems to be moving backwards with insults thrown in. As an IP and various identities, Apteva has made over 300 edits to the SE main page and talk page but hardly any well-referenced content has been added. I enjoy this subject so I've helped write a comprehensive page that blows away anything on Britannica, World Book or Encarta. I've had help from Perlin, De Winter, Maycock, Berman, Varardi, Scheffler, Sklar, etc. who have answered questions in the course of developing this page. Several of those guys are literally Solar Energy Hall of Famers and it's been a joy to communicate with all of them as well as learn the ins and outs of WP. For all the research and work I'm called clueless. Paid by work to f-up the page? Wait for it... Wait for it... wow. Mrshaba (talk) 23:30, 14 July 2008 (UTC)
- It is possible that the process is going to be slow going for two weeks. I would suggest using the collage as proposed above in the meantime. Apteva (talk) 00:48, 15 July 2008 (UTC)
I had hoped some of the less civil comments were just blowing of steam, but it seems that it is continuing to be an issue, so I would like to remind everyone that mediation only works in a collaborative environment when everyone works in a positive attitude to create a solution to a situation.
It seems the collage idea, at least for now, is not working, so I'd like to explore another idea, having a lot of photos on the right column may not look pretty, but is there a way to toss one photo at the top right and one at the top left of the first section after the table of contents; can we try rearranging the justification of the images to create more spaces? MBisanz talk 04:00, 15 July 2008 (UTC)
- MBisanz if you have a minute to play around with that it would be great. I don't know if I'll like it till I see it though. Given that the incivility is still here, and I have been too close to the arguments to be able to deal with it myself, I wonder if you have any suggestions. Can we find someone to mediate between these two users, and keep the questions about the article separate? Itsmejudith (talk) 09:35, 15 July 2008 (UTC)
- A mediation of a mediation?? What? You know it is funny that Mrshaba complains that I have made over 300 edits to the Solar energy page and talk page yet have added little content. Well I have worked on over 300 other articles and added substantive content to them, but have specifically avoided adding any content to the solar energy article because of Mrshaba's protectionism. Mrshaba apparently doesn't even know that he can work on other articles - preferring to instead drop suggestions onto talk pages instead of just making the edits. Apteva (talk) 11:48, 15 July 2008 (UTC)
- How about like this?[5] Apteva (talk) 21:37, 15 July 2008 (UTC)
- Thanks, but I doubt if it's neat enough to meet FA. Doesn't address my concerns about too many electric-related images up front either. Apteva, please can you try, try, try not to keep making comments about Mrshaba's behaviour. Making suggestions on talk pages can be a good thing! We really will not get anywhere unless we learn to work together and that means a lot of give and take. I need to learn that too. Itsmejudith (talk) 00:07, 16 July 2008 (UTC)
- The collage would be fine for FA. The article needs a lot of copy-editing before it will be ready for FA - you may have noticed that I made a lot of changes to the grammar in the lead - the subject and verb don't agree in the current caption under the sun - heat and light is plural, fuels is singular. I haven't fixed it because I don't want it to stay. You are saying that one electric related image up front is too many? The "dots" image is not electric related. It shows the total land area required to provide all of our energy from solar energy. In 50 years there won't be any coal, oil, natural gas or nuclear left - the only things left will be solar, wind and geothermal. Exotic nuclear like fusion has been "fifty years away" for the last fifty years, and will remain fifty years away as long as there is an alternative - solar and wind, which will last forever (ok a billion years, but that's pretty long). Apteva (talk) 04:42, 16 July 2008 (UTC)
- I was too hasty and not thinking that you wanted to put these into a collage. I think I need to go away and read more about the dots image, where it has been published, how we would explain it. Your post doesn't reassure me at all, since you are evoking an extreme version of the Peak oil thesis, but I will have a completely open mind about the image itself. You don't have to convince me of the importance of solar, and let's remember that the article is not means to convince anyone of anything. Don't worry about the copyediting for FA; let's sort the content out. There is a league of copyeditors who can do all that. Are you on board for trying to get the article up to FA? Itsmejudith (talk) 07:19, 16 July 2008 (UTC)
- The league of copy-editors is now defunct. I would love to see every article be FA. This one isn't any more important to me than any other article. And trust me I only expect the article to be encyclopedic, nothing more, nothing less. This isn't science fiction, it's science fact. The peak oil and global warming articles are the province for duking it out about those subjects, not this one. The three choices I proposed were, collage[6], Nellis and dots[7], and the one that is just an interim arrangement to fill up the space beside the toc, a compromise that no one likes but just doesn't run down the page so far while we are "discussing".[8] It isn't supposed to be a collage, it is just a temporary way of fitting all the current images into the available space better. Apteva (talk) 07:39, 16 July 2008 (UTC)
- I was too hasty and not thinking that you wanted to put these into a collage. I think I need to go away and read more about the dots image, where it has been published, how we would explain it. Your post doesn't reassure me at all, since you are evoking an extreme version of the Peak oil thesis, but I will have a completely open mind about the image itself. You don't have to convince me of the importance of solar, and let's remember that the article is not means to convince anyone of anything. Don't worry about the copyediting for FA; let's sort the content out. There is a league of copyeditors who can do all that. Are you on board for trying to get the article up to FA? Itsmejudith (talk) 07:19, 16 July 2008 (UTC)
- The collage would be fine for FA. The article needs a lot of copy-editing before it will be ready for FA - you may have noticed that I made a lot of changes to the grammar in the lead - the subject and verb don't agree in the current caption under the sun - heat and light is plural, fuels is singular. I haven't fixed it because I don't want it to stay. You are saying that one electric related image up front is too many? The "dots" image is not electric related. It shows the total land area required to provide all of our energy from solar energy. In 50 years there won't be any coal, oil, natural gas or nuclear left - the only things left will be solar, wind and geothermal. Exotic nuclear like fusion has been "fifty years away" for the last fifty years, and will remain fifty years away as long as there is an alternative - solar and wind, which will last forever (ok a billion years, but that's pretty long). Apteva (talk) 04:42, 16 July 2008 (UTC)
- Thanks, but I doubt if it's neat enough to meet FA. Doesn't address my concerns about too many electric-related images up front either. Apteva, please can you try, try, try not to keep making comments about Mrshaba's behaviour. Making suggestions on talk pages can be a good thing! We really will not get anywhere unless we learn to work together and that means a lot of give and take. I need to learn that too. Itsmejudith (talk) 00:07, 16 July 2008 (UTC)
The dot image is electric related judging from the description that talks about using 8% efficient solar cells covering the areas specified on the picture to replace the primary energy (PE) supply with electricity. Dr. Loster is a smart fellow and his picture has merit but I'm not sure the underlying assumptions of the picture are appropriate. About a third of the world's PE supply (.15 ZJ) is used to make electricity but during the conversion process .10 ZJ is converted to waste heat and only .05 ZJ is converted to electricity. There is no need to replace primary energy that is lost in the electrical conversion process so why construct a picture with a higher benchmark than required? Why use 8% efficient panels when 10% is still conservative and the math works out a whole lot easier? Why have things in units of average power instead of average energy as insolation is generally measured (kWh/day). He could have also simplified things by using the same sized areas in all the deserts by shifting things ever so slightly. I asked him to address these things and change the background from gray to white... He changed the background and for that I'm grateful. The issues above don't address how strange it is to use 8% efficient panels in the desert to make electricity that will later be converted to some sort of process heat when you can use 65% efficient heating panels on your roof to do the same job. I know Lumos3 had serious issues with the picture when it was introduced to the page. As I understand it Dr. Loster used the image on his Christmas cards a few years back but this use doesn't reassure me. The fact that the picture was uploaded well before it was published also makes me wonder. Is it a useful picture? Weak support... Could it be improved... Considerably. The multiple layers of math involved in deciphering the picture make it a poor choice for the lead. The text in the Energy from the Sun section correlates relatively well with the dot picture whereas the lead material doesn't at all.
As stated above I think the lead needs a single picture of the Sun. This is the most common image associated with solar energy related institutions and companies. It's a simple big picture way to introduce the page in a generic and non-POV way. It's clean and visually attractive. Solar = Sun... Mrshaba (talk) 23:26, 16 July 2008 (UTC)
From my point of view moving the dot image to the lead is being thrown out there as a way to salvage the box diagram by moving it into the Energy from the Sun section. A clear consensus has been established against the box diagram through the RFC and previous discussions. Do we need to run another RFC to establish this for a second time? Mrshaba (talk) 23:39, 16 July 2008 (UTC)
- These arguments are convincing for me and they move us back onto discussion of content rather than editorship (except for the final para where I wouldn't like to make assumptions about motivation). Itsmejudith (talk) 23:59, 16 July 2008 (UTC)
- Thanks Judith... I made the assumption because the all the collage proposals above have moved the box diagram down into the Energy from the Sun section. [9], [10], [11]. A clear consensus has been established against the box diagram and I don't want to simply move this long term problem from one part of the page to another. Mrshaba (talk) 00:38, 17 July 2008 (UTC)
There was a bit of a fuss about the dot diagram a long time ago, about the size of the dots, and I pointed out that visually the dots are small and they would still be small if you doubled their size or halved it (halved or doubled the efficiency), and would not be detectably different in the image. I have seen one solar technology that heats water and generates electricity in the same device, producing about equal kW of each. Such finer points as that are pretty moot. The dot image works equally well if you assume that the world uses no electricity and gets all of its energy from steam generated from 65% efficient solar concentrators - the fact that the dots are showing the area needed for 8% efficient just implies that they would need to be even smaller if the efficiency was 65%. You are examining the image way too closely. I do recall one version of the dot image that someone suggested moving one of the dots out of Siberia where there is no sun and into the Gobi desert... Both the dot image and the box image are excellent and are essential to the article. However, I would like to stick to the agenda and discuss one thing at a time - do you have any objection to using this version[13] until we get a resolution? It's a lot less cluttered than the current version and keeps all the same images that are locked during the duration of the mediation. Apteva (talk) 03:05, 17 July 2008 (UTC)
Dots and boxes[edit]
Why are the dot and box diagrams excellent? Everyone in the RFC and previous discussions have had negative opinions of the box diagram. WP is supposed to work on consensus and there has been a consensus against the box diagram. And I'm not questioning the size of the dots but rather the appropriateness of the assumptions that the diagram is built on. It could use assumptions that communicate more effectively. You said the diagram is not about electricity/PV but it clearly is and this gets back to the idea of PV pushing in the lead. Altogether I think it probably belongs on the PV page but at least if fits into the context of the Energy from the Sun section. If the additional source Matthias listed as a publisher has another alternative version I think the picture might have to go altogether. I'd like to see this version: [14] Mrshaba (talk) 04:02, 17 July 2008 (UTC)
- And I don't. You haven't answered my question that I have asked two or three times about a temporary layout. Since we have a little down time I'm happy to discuss the dots and box images. You are being absurdly picky about the dots image. It's fine as is. As to the box image, as our moderator said, the box image "conveys a clear scientific message about solar energy". I don't think you can get clearer than that. You may recall that I printed out the image and showed it to a random group of people - and it turned out that only the very small minority of people who accepted nuclear power didn't like it. Evidently you are also of that group. I don't expect everyone to like everything or accept everything, but the image is very useful for the article, because it answers the question, what is the relationship between our energy needs and other renewable energy sources, such as wind and geothermal? Apteva (talk) 05:57, 17 July 2008 (UTC)
- I'll have to disagree with the moderator and point out that he's only the second person to say something positive about the box diagram. There's been a consensus against the box image and many people have commented that the picture is not clear and given specific reasons why it is not clear. I don't think your random survey is an appropriate reason to avoid consensus. Another issue with the box diagram is that the numbers are for eXergy rather than eNergy and I'm pretty sure only a "small minority" of people understand the eXergy concept. Why have you avoided the consensus to remove the box image? Mrshaba (talk) 15:57, 17 July 2008 (UTC)
- Why have you avoided the consensus to remove the box diagram? Mrshaba (talk) 20:15, 17 July 2008 (UTC)
- What consensus? It's an important image, and the new one is even better than the old one. About the only thing you have said against it is you made the picky complaint that it says 86,000 instead of 89,000 - any number within +/-20% is close enough. Or even +/-50% for that matter. The wind number used to be 370, now it is 870. Since 3's and 8's look a lot alike I suspect that the original 3 should have been an 8. But its just an estimate anyway, and both are close enough. By the way, according to the article on exergy, for an isothermal process, exergy and energy are interchangeable terms. Apteva (talk) 22:59, 17 July 2008 (UTC)
- This consensus. Mrshaba (talk) 14:47, 18 July 2008 (UTC)
- That's not a consensus, that's a discussion. I interviewed three times as many people as that and got the exact opposite result. I invited you or anyone else to print out the image but got no takers. There are a thousand times as many people who use WP as edit it and at least I made an effort to find out what those thousand thought of the image. Apteva (talk) 23:38, 18 July 2008 (UTC)
- This consensus. Mrshaba (talk) 14:47, 18 July 2008 (UTC)
- What consensus? It's an important image, and the new one is even better than the old one. About the only thing you have said against it is you made the picky complaint that it says 86,000 instead of 89,000 - any number within +/-20% is close enough. Or even +/-50% for that matter. The wind number used to be 370, now it is 870. Since 3's and 8's look a lot alike I suspect that the original 3 should have been an 8. But its just an estimate anyway, and both are close enough. By the way, according to the article on exergy, for an isothermal process, exergy and energy are interchangeable terms. Apteva (talk) 22:59, 17 July 2008 (UTC)
It looks like a consensus to me. Does anyone else have an opinion? Mrshaba (talk) 23:48, 18 July 2008 (UTC)
- Now the numbers are going everywhere! A 3 mistaken for an 8, "just an estimate anyway", "within 20%". This isn't how we should be working in an encyclopedia - in a science and technology article. We can't mess about with images - it's original research. And it's no good saying "near enough". Are we going to tell the world that we don't care about measurement? No, no, no good at all. The RfC was the right way to proceed. It didn't just get straw poll answers, it got knowledgeable editors making a range of different points. I appreciate that you made an effort to do your own survey, but sorry, the results are meaningless. It wasn't an independent poll with a random sample. You didn't ask thousands of people; you asked people you knew. I don't mind printing out the image, but why? This is an online encyclopedia and if the image doesn't work online it won't work at all. Sorry if I sound like I am coming down like a ton of bricks - I'm afraid this time I am coming down like a ton of bricks. Maybe I should have done that earlier. I wonder what the editors who bothered to contribute to the RfC think about us still discussing the issue all this time later? Perhaps we should contact them. I don't think it will count as canvassing, but I'll be guided by the mediator. Itsmejudith (talk) 00:11, 19 July 2008 (UTC)
- Please, it would be a ridiculously biased survey if I interviewed people that I knew - no I asked random people that I did not know. Science always works with the best information that we have - and we always try to improve the accuracy of our estimates - but we also have to be realistic about how accurate our answers need to be. Ever since scientific calculators became available students have been inputing two digit numbers and writing down answers on their test papers, erroneously, to ten digits. I don't know if either of you have a science background - it doesn't matter either way, because articles need to be balanced between those with absurd science backgrounds and those with absurd views of science. Just ask yourself, if you live by a river that you know has 89,000 fish spawning every year and your tribe needs 15 fish to survive every year - how accurately do you really need to know the number of fish in the river, assuming no export/import of course? Is one digit accuracy sufficient? Is an order of magnitude sufficient? Is two orders of magnitude sufficient? Answer - yes. On the other hand, you need a lot better accuracy of the second number, the number of fish taken each year, in this case not because there is a limited supply, which for your purposes might as well be infinite, but for internal accounting purposes. So you can see that it depends on what the number is as to how important is the accuracy. Fishermen, by the way are horrible at depleting stocks and destroying their own livelihood, simply because instead of living by a river that spawns 89,000 fish and needing 15, they live in a tribe that can readily consume 89,000 beside a river that spawns only 15 - and they insist on taking more than are sustainable (if 15 are spawned, it is possible that taking 5 or 6 is a sustainable level - yet fishermen insist on taking 7 or 8). Anyway, the bottom line is that solar energy is for all practical purposes an infinite resource since it so greatly exceeds our needs, wind is an adequate resource, as it can probably sustain 5 times our needs, and geothermal is a significant resource but probably can not sustain more than roughly a third of our needs. Apteva (talk) 04:22, 19 July 2008 (UTC)
- The consensus has been against the box diagram. Why are you avoiding this consensus by repeatedly inserting the box diagram? The agreement below was to remove all the lead pictures but you have again reinserted the box diagram. What do you think mediator? What do you think Itsmejudith. This has gone on for an unreasonable length of time. Mrshaba (talk) 05:33, 19 July 2008 (UTC)
- For one thing, the only discussion that there has ever been about it was a complaint that it was removed. For another it's a good diagram. Why shouldn't I put it back in the article for both of those reasons? There was an earlier version that sort of looked like oil drums for energy use, and it used a semi-log bar graph as a way to compare the hugely disparate numbers, but it didn't work any where near as well as the boxes. As was discussed if you used spheres it would just be mistaken for a model of the solar system. Apteva (talk) 05:47, 19 July 2008 (UTC)
- We had a discussion about the box diagram during the RFC and everyone thought it was a poor diagram. Itsmejudith has added her opinion above. It's not a good diagram according to all these people that have commented on WP. You are avoiding consensus on this simple correction. Mrshaba (talk) 15:38, 19 July 2008 (UTC)
- Everyone? Clearly someone there thought it was a good diagram. Our moderator likes it. If you can find a better image that compares solar, wind, geothermal and current energy use I would be happy to use it instead. Apteva (talk) 16:08, 19 July 2008 (UTC)
- Everyone but you was against the diagram. Everyone. Our moderator did not participate in the RFC and previous discussions. Where are you moderator? This has been going on for almost a year. Is avoiding consensus and stonewalling of this sort a cause for arbitration. What do you think Itsmejudith? This does not seem like good faith participation. Mrshaba (talk) 16:36, 19 July 2008 (UTC)
- Everyone? Clearly someone there thought it was a good diagram. Our moderator likes it. If you can find a better image that compares solar, wind, geothermal and current energy use I would be happy to use it instead. Apteva (talk) 16:08, 19 July 2008 (UTC)
- We had a discussion about the box diagram during the RFC and everyone thought it was a poor diagram. Itsmejudith has added her opinion above. It's not a good diagram according to all these people that have commented on WP. You are avoiding consensus on this simple correction. Mrshaba (talk) 15:38, 19 July 2008 (UTC)
- For one thing, the only discussion that there has ever been about it was a complaint that it was removed. For another it's a good diagram. Why shouldn't I put it back in the article for both of those reasons? There was an earlier version that sort of looked like oil drums for energy use, and it used a semi-log bar graph as a way to compare the hugely disparate numbers, but it didn't work any where near as well as the boxes. As was discussed if you used spheres it would just be mistaken for a model of the solar system. Apteva (talk) 05:47, 19 July 2008 (UTC)
- The consensus has been against the box diagram. Why are you avoiding this consensus by repeatedly inserting the box diagram? The agreement below was to remove all the lead pictures but you have again reinserted the box diagram. What do you think mediator? What do you think Itsmejudith. This has gone on for an unreasonable length of time. Mrshaba (talk) 05:33, 19 July 2008 (UTC)
- Please, it would be a ridiculously biased survey if I interviewed people that I knew - no I asked random people that I did not know. Science always works with the best information that we have - and we always try to improve the accuracy of our estimates - but we also have to be realistic about how accurate our answers need to be. Ever since scientific calculators became available students have been inputing two digit numbers and writing down answers on their test papers, erroneously, to ten digits. I don't know if either of you have a science background - it doesn't matter either way, because articles need to be balanced between those with absurd science backgrounds and those with absurd views of science. Just ask yourself, if you live by a river that you know has 89,000 fish spawning every year and your tribe needs 15 fish to survive every year - how accurately do you really need to know the number of fish in the river, assuming no export/import of course? Is one digit accuracy sufficient? Is an order of magnitude sufficient? Is two orders of magnitude sufficient? Answer - yes. On the other hand, you need a lot better accuracy of the second number, the number of fish taken each year, in this case not because there is a limited supply, which for your purposes might as well be infinite, but for internal accounting purposes. So you can see that it depends on what the number is as to how important is the accuracy. Fishermen, by the way are horrible at depleting stocks and destroying their own livelihood, simply because instead of living by a river that spawns 89,000 fish and needing 15, they live in a tribe that can readily consume 89,000 beside a river that spawns only 15 - and they insist on taking more than are sustainable (if 15 are spawned, it is possible that taking 5 or 6 is a sustainable level - yet fishermen insist on taking 7 or 8). Anyway, the bottom line is that solar energy is for all practical purposes an infinite resource since it so greatly exceeds our needs, wind is an adequate resource, as it can probably sustain 5 times our needs, and geothermal is a significant resource but probably can not sustain more than roughly a third of our needs. Apteva (talk) 04:22, 19 July 2008 (UTC)
- I think I listed about half a dozen images I liked for being good images and said that I couldnt figure out which was my favorite, Another comment I made was that it is a bit hard to read the box image on my monitor. Also, looking at it again, it feels a bit plain as an image, but it conveys good content. I wonder if we couldn't recreate the information (the relative size of energy contributions) in a different style, themed with more solar images. I may (flew in last night, flying out tomorrow) be able to do some stuff in Excel, but wonder if we can maybe find a way to merge the awe of the sun as the center of our world-view with the surprising facts its energy output. MBisanz talk 22:38, 19 July 2008 (UTC)
- Sources is the important thing. And we are here to describe solar energy, not to promote it. We let the facts speak for themselves. We can't dictate how readers will view the article. I am more than happy to include info about the potential of solar energy - if we have reliable sources that cover that discussion, and I think we do. Apteva, I do know what approximation is. The fact is: we can't mess about with images. Imagine if I am editing the article about Mount Fuji and I have an image, but I want to portray the mountain with cherry blossom in the foreground, because I know that is how Japanese people prefer to see Mount Fuji. But I haven't got an image with cherry blossom, so I photoshop an image to add some. Unacceptable, however faithfully it reflects the article subject. Itsmejudith (talk) 22:46, 19 July 2008 (UTC)
- Good point, we do have WP:NPOV to deal with, so promoting things is generally outside what we do. I wonder though if the box image, which displays energy potential, in an albeit supportive manner, can be recast to focus more on the fact that there is a huge difference in energy output, and doing so with a more solar-themed message. Lastly, I'm still not supporting any image for lead, just trying to mix and match and splice stuff to see what falls out. MBisanz talk 22:56, 19 July 2008 (UTC)
- Thanks. I don't know what we are allowed to do with an image apart from resize or crop it. I'll have a look at WP:NPOV again to see if it says anything. I have a general concern about images and POV in the encyclopedia. Itsmejudith (talk) 23:48, 19 July 2008 (UTC)
- Actually we can create whatever image we wish as long as it doesn't distort the facts and is of an encyclopedic subject. Photo-shopping cherry blossoms is a bit tacky, but creating pie charts or whatever from data is totally acceptable. The box image simply informs the reader visually of the data. Before we had the dots and boxes images there were multiple requests for such an image, which is why they were created - by request. You notice that I'm totally open to suggestions for a replacement, however, as long as it shows the same information. I think it is false to say that the image represents solar energy in a "supportive manner". Would you call it in a "negative manner" if the numbers were reversed, if total world energy demand was 89,000 TW and total solar radiation was 15 TW? No. Neither would be called supportive nor negative, both would be called "accurate". Apteva (talk) 03:17, 20 July 2008 (UTC)
- In my stats classes, we often learned that 3D graphs, even when done actually, distort perspective on a 2D platform, in this case the distortion probably favors the Geothermal and Global part of the image, since they would, I suspect, be a pin point if properly scaled. MBisanz talk 05:28, 20 July 2008 (UTC)
- I'm not really interested in trying to count the pixels to find out. If they are correct, the pixel ratios of each side should be the cube root of the values: 44.14 to 9.55 to 3.17 to 2.47, although because of the perspective only the front face can be measured. Apteva (talk) 07:24, 20 July 2008 (UTC)
- In my stats classes, we often learned that 3D graphs, even when done actually, distort perspective on a 2D platform, in this case the distortion probably favors the Geothermal and Global part of the image, since they would, I suspect, be a pin point if properly scaled. MBisanz talk 05:28, 20 July 2008 (UTC)
- Actually we can create whatever image we wish as long as it doesn't distort the facts and is of an encyclopedic subject. Photo-shopping cherry blossoms is a bit tacky, but creating pie charts or whatever from data is totally acceptable. The box image simply informs the reader visually of the data. Before we had the dots and boxes images there were multiple requests for such an image, which is why they were created - by request. You notice that I'm totally open to suggestions for a replacement, however, as long as it shows the same information. I think it is false to say that the image represents solar energy in a "supportive manner". Would you call it in a "negative manner" if the numbers were reversed, if total world energy demand was 89,000 TW and total solar radiation was 15 TW? No. Neither would be called supportive nor negative, both would be called "accurate". Apteva (talk) 03:17, 20 July 2008 (UTC)
- Thanks. I don't know what we are allowed to do with an image apart from resize or crop it. I'll have a look at WP:NPOV again to see if it says anything. I have a general concern about images and POV in the encyclopedia. Itsmejudith (talk) 23:48, 19 July 2008 (UTC)
- Good point, we do have WP:NPOV to deal with, so promoting things is generally outside what we do. I wonder though if the box image, which displays energy potential, in an albeit supportive manner, can be recast to focus more on the fact that there is a huge difference in energy output, and doing so with a more solar-themed message. Lastly, I'm still not supporting any image for lead, just trying to mix and match and splice stuff to see what falls out. MBisanz talk 22:56, 19 July 2008 (UTC)
- Sources is the important thing. And we are here to describe solar energy, not to promote it. We let the facts speak for themselves. We can't dictate how readers will view the article. I am more than happy to include info about the potential of solar energy - if we have reliable sources that cover that discussion, and I think we do. Apteva, I do know what approximation is. The fact is: we can't mess about with images. Imagine if I am editing the article about Mount Fuji and I have an image, but I want to portray the mountain with cherry blossom in the foreground, because I know that is how Japanese people prefer to see Mount Fuji. But I haven't got an image with cherry blossom, so I photoshop an image to add some. Unacceptable, however faithfully it reflects the article subject. Itsmejudith (talk) 22:46, 19 July 2008 (UTC)
I think the existing text based comparison of energy values is the best way to present this info. Many people have mentioned that a 3D description of 1D info is deceptive and counterproductive. [15] Mrshaba (talk) 20:15, 20 July 2008 (UTC)
- Yes. The figures in the diagram could just as easily be presented as a table of figures. Sorry to go right back to the basic questions, but what exactly is the source for the figures? Can we use that? Because if it is not a reliable enough source to be used as a table, it certainly isn't reliable enough to be translated into a diagram. Itsmejudith (talk) 20:51, 20 July 2008 (UTC)
| Yearly Solar fluxes & Human Energy Consumption | |
|---|---|
| Solar | 3,850 ZJ [2] |
| Wind | 2.25 ZJ [3] |
| Biomass | 3.0 ZJ [4] |
| Electricity (2005) | 0.0567 ZJ [5] |
| Primary energy use (2005) | 0.487 ZJ [6] |
The table also solves the problem of having a bullet list while maintaining the linear comparison. Mrshaba (talk) 21:30, 20 July 2008 (UTC)
- What bullet list? That was replaced with a paragraph a couple of days ago. Apteva (talk) 23:24, 20 July 2008 (UTC)
The source for the box diagram is Stanford... Again though, the data is for eXergy rather than eNergy and I think this adds another aspect of confusion to the box diagram. The consensus against the box diagram should be enough to remove it without these additional problems. There are clearly better diagrams and/or pictures that can occupy the space. Mrshaba (talk) 21:53, 20 July 2008 (UTC)
- Can you clarify: the source for the data in the box diagram is Stanford. Not the source of the diagram itself, which is self-drawn. Is that right? Itsmejudith (talk) 22:27, 20 July 2008 (UTC)
- The natural energy flux data comes from Stanford. The primary energy consumption data comes from the Department of Energy's Energy Information Administration. The diagram is a representation comparing this data and is, as you say, self-drawn. Mrshaba (talk) 22:37, 20 July 2008 (UTC)
- So Stanford present this data in the form of a really complicated chart. I'm even more sure than before that it isn't right to take a few of these figures out and present them again in a different format. Itsmejudith (talk) 22:57, 20 July 2008 (UTC)
- The natural energy flux data comes from Stanford. The primary energy consumption data comes from the Department of Energy's Energy Information Administration. The diagram is a representation comparing this data and is, as you say, self-drawn. Mrshaba (talk) 22:37, 20 July 2008 (UTC)
- Nothing wrong with picking which numbers to diagram - the same source could have been used for example for the nuclear energy article to diagram the relationship between available Uranium and Deuterium. Saying you can't pick things out is like saying that if you are writing a paper and want to use a book for a reference you have to put the whole book into your paper, because the quote you wanted could otherwise be taken out of context. Apteva (talk) 23:24, 20 July 2008 (UTC)
Clear Lead[edit]
Just a teeny correction, I was commenting generally on the images, I have, after looking at all of them, been unable to pick a personal favorite. For the time being, could we try an article with no lead image maybe? MBisanz talk 06:08, 17 July 2008 (UTC)
- Ok by me. Apteva (talk) 14:35, 17 July 2008 (UTC)
- Fine for the time being. At some point we need to move forward though. I know we already had an RfC, but it would be nice to have some more editors' opinions. Then, when the mediation has done its work, can we again agree a to-do list and work on it. Apteva, for Mrshaba and me that will mean progress towards FA. Even if that's not on your agenda, will you still work on the basis of an agreed to-do? Itsmejudith (talk) 15:13, 17 July 2008 (UTC)
- Sure, I always do. Apteva (talk) 15:44, 17 July 2008 (UTC)
- Great. And we'll AGF? And not try and second-guess each others' views on nuclear? Of course out there sometimes the issue does get posed in either/or solar/nuclear terms, but it is posed in other terms too. E.g. the UK government line is to build more nuclear plants but also to encourage UK companies to sell solar in less developed countries. Most of that debate is for other pages - I don't know what they are - Energy policy? But if you think we should include more of it here, then it's worth considering. Itsmejudith (talk) 15:54, 17 July 2008 (UTC)
- Sure, I always do. Apteva (talk) 15:44, 17 July 2008 (UTC)
Table vs. Diagram[edit]
| Table | Diagram | |
| Yearly Energy Sources & Annual Energy Consumption | 
| |
|---|---|---|
| Solar [7] | 3850.00 ZJ | |
| Wind [8] | 2.25 ZJ | |
| Biomass [9] | 3.00 ZJ | |
| Electricity (2005) [10] | -0.06 ZJ | |
| Primary energy use (2005) [11] | -0.49 ZJ | |
There are two problems with using these numbers in a table - they are better described in the current paragraph, and secondly they come from a hodge-podge of sources so they wouldn't make a good source for a diagram. While a second reference is used for the source of one number, if you add up all the data in the first reference you reach the same total of 15 TW (ok technically 15.0165 if you want to be exact). In addition most people are visual and not mathematical - it may seem strange but a lot of people don't know whether 2 or 7 is larger than the other, let alone 0.02 and 700. Yet if you make a bar graph like this everyone can tell which is larger.
| 2 |
| 7 |
Volumes were used instead of bars to keep one from being a millimeter long (which wouldn't be visible) and the other 5.7 meters (which wouldn't fit on the screen). You are trying to solve a problem that doesn't exist, because it has already been taken care of - how to represent the relationship between available solar, wind, and geothermal, and existing energy demand. The current image does that nicely. If you were only comparing geothermal with energy use a bar graph would need to be used as they are both the same order of magnitude (one is twice the other). It is helpful to easily see the size relationship as in big and small not as in a specific ratio big, although since the data is also presented the diagram shows both, while the table only shows meaningless numbers to many. Apteva (talk) 23:24, 20 July 2008 (UTC)
- I can't make much sense of your argument. I sure hope the people reading the article know that 2 is smaller than 7 and so on. Are you arguing otherwise? The visual part of a three dimensional representation hides the volume comparison so that you're left comparing the numbers. A table or text based description compares the numbers without hiding anything. You've argued for this box diagram against well over a dozen people who think the diagram is rubbish? You're out on a limb. How many people need to disagree with you before you stop arguing otherwise. Mrshaba (talk) 23:56, 20 July 2008 (UTC)
- I am arguing otherwise. Try watching Jay Leno's segment "Jaywalking". It is almost unbelievable how stupid a lot of people are. Just look at some of the vandalism we see to solar energy when schools are in session. Just look at the current president of the US. It took him six years to learn how to pronounce nucular as nuclear. I'm sure there are a thousand people out there I would be happy to disagree with about this diagram. Numbers don't matter. Facts do. Look at the comparison above and tell me which side allows you an easier way to tell which is bigger, solar or wind, the table or the diagram? Now imagine you are in continental Europe, where commas are used as decimal points and periods as thousands dividers, so the table shows that solar is a little less than 4 and wind is over 2 thousand, if those are the only numbers that you looked at. Apteva (talk) 00:33, 21 July 2008 (UTC)
- Numbers don't matter and readers don't know that 2 is smaller than 7? Wow... We've given this a good go but I think this needs to go to arbitration. Mrshaba (talk) 00:49, 21 July 2008 (UTC)
- Just answer the question. Which side allows you to see which is bigger the easiest, solar or wind, the table or the diagram? Apteva (talk) 00:52, 21 July 2008 (UTC)
- Apteva has modified the table title and added - signs and extra zeros. I think this needs to go to arbitration. Mrshaba (talk) 01:01, 21 July 2008 (UTC)
- I changed the title because the title you used was not meaningful. Are you calling wind a solar flux? Here I'll put the numbers back, but leave the minus signs. Better yet, I'll line up the decimal points. But please answer the question, which side tells you which is bigger the easiest? Apteva (talk) 02:05, 21 July 2008 (UTC)
- Apteva has modified the table title and added - signs and extra zeros. I think this needs to go to arbitration. Mrshaba (talk) 01:01, 21 July 2008 (UTC)
- Just answer the question. Which side allows you to see which is bigger the easiest, solar or wind, the table or the diagram? Apteva (talk) 00:52, 21 July 2008 (UTC)
- Numbers don't matter and readers don't know that 2 is smaller than 7? Wow... We've given this a good go but I think this needs to go to arbitration. Mrshaba (talk) 00:49, 21 July 2008 (UTC)
- I am arguing otherwise. Try watching Jay Leno's segment "Jaywalking". It is almost unbelievable how stupid a lot of people are. Just look at some of the vandalism we see to solar energy when schools are in session. Just look at the current president of the US. It took him six years to learn how to pronounce nucular as nuclear. I'm sure there are a thousand people out there I would be happy to disagree with about this diagram. Numbers don't matter. Facts do. Look at the comparison above and tell me which side allows you an easier way to tell which is bigger, solar or wind, the table or the diagram? Now imagine you are in continental Europe, where commas are used as decimal points and periods as thousands dividers, so the table shows that solar is a little less than 4 and wind is over 2 thousand, if those are the only numbers that you looked at. Apteva (talk) 00:33, 21 July 2008 (UTC)
I don't think the mediation is working towards a solution. I think this should go to arbitration. Mrshaba (talk) 02:13, 21 July 2008 (UTC)
- Have a little patience. But quit being a broken record - I heard you the first time, the second time and the third time. Now quit ignoring me and answer the question. You too, Itsmejudith - which is easier to to see if wind or solar is bigger, the table or the diagram? Apteva (talk) 04:44, 21 July 2008 (UTC)
Wow, I really need to learn to not be stuck in LaGuardia for a day waiting for a flight. In any event, I see I have a lot to read. One point though, Mediation here is the end of the road for this article, Arbitration is only for user behavior, not disagreements on articles and content, so we all need to try and may this work if a stable article is to result. Since we can do some basic charts, is there any agreement to move in that direction? Also, I know that logarithmic scales tend to be good for instances where there is a wide variance in numbers. That might be worth investigating with a graph of some sort. MBisanz talk 05:40, 21 July 2008 (UTC)

- Yes, we will make sure the mediation works. I think the table works much better than the diagram. For me, tabular form is the way to go and the discussion now should be about which figures go in the table and how well they are sourced. If we eventually decide to turn the table into a graph of some kind, it has to be based on a table anyway. MBisanz, I'm afraid I don't think a logarithmic scale is good in this case, as it could confuse the less mathematically literate reader. Itsmejudith (talk) 11:50, 21 July 2008 (UTC)
- I would prefer a diagram. However, I agree that logarithmic scales are commonly misinterpreted as linear - how many people think that a 7.5 earthquake is only a "little" stronger than a 7.2, when actually it is twice as strong? Here is the first version of the above diagram, done as a log bar graph. Apteva (talk) 18:04, 21 July 2008 (UTC)
- I am about to go off for an extended wikibreak until early September. Before I go, can I say that I would prefer to see full agreement 1) about the sources that compare the available energy from solar, wind, fossil fuels etc 2) what figures we can legitimately draw from the sources without making an original synthesis 3) where it is to be located in the article and in what context and only then 4) whether we display figures in a table, diagram or both. Best of luck everyone. Itsmejudith (talk) 10:19, 24 July 2008 (UTC)
- I guess I see WP as more of a compromise - as long as the numbers are reasonable there is no point in twiddling them. The main focus I have is fixing bad information and providing useful information - so that the half a million people who view the article between now and when you get back have something useful to see - for example not changing 0.056 to 0.0056 for example. With Itsmejudith and Mrshaba on wikibreak, while I think we have all learned a lot from this mediation, even though we did not reach a concrete resolution the article is better now than when we started. I think we need to either close this or suspend it if no one else is here but me. I would suggest that if no one adds an image to the lead, in a month I will put up the collage as a trial balloon for a week, and then take it down again - just to see if anyone responds. Ditto for using a table instead of the diagram. I believe that biomass is still the largest energy source in the world, even bigger than oil, although it is not accurately measured - with billions of people in the third world using it as their only source of energy. In the last few years many small solar panels have been distributed in India and Africa, though, transforming lives, plus the one laptop per child project has brought (or will soon bring) computer skills to another couple million, not a big dent, but a start (who knows maybe one six year old from Peru on one will become our next WP wizkid). In the west we have seen a huge rarification of wealth, with the rich getting a lot richer (taxes have become optional for the rich - they used to pay 90 to 95% of income - remember the Beatles song, Taxman - "there's one for me, nineteen for you") and the poor getting poorer, with an abnormally high percentage of them in the US being vets, but in the rest of the world the poor have gotten a lot richer, and there are continued hopes to eliminate poverty in the next decade - so who knows what the world demographics will be then. Bill Gates has committed to giving away most of his wealth instead of passing it on to his kids - they each have to earn their own money - they "only" get 3 billion apiece (one report puts it as less than 30 million). What we do know for certain, however, is that there will still be a Wikipedia article on solar energy, and one by one the number of FA articles continues to inch ahead - and hopefully solar energy will be one of them. Apteva (talk) 14:48, 24 July 2008 (UTC)
- I am about to go off for an extended wikibreak until early September. Before I go, can I say that I would prefer to see full agreement 1) about the sources that compare the available energy from solar, wind, fossil fuels etc 2) what figures we can legitimately draw from the sources without making an original synthesis 3) where it is to be located in the article and in what context and only then 4) whether we display figures in a table, diagram or both. Best of luck everyone. Itsmejudith (talk) 10:19, 24 July 2008 (UTC)
- One of the nice things about mediation, compared to arbitration, is there is much less need to reach a quick decision. We might try letting the article sit in various states for periods of time and trying to invite new editors to the article to design better graphics presentation. When I am able to (14 hour day yesterday hurt) I will try toying around in Excel. MBisanz talk 14:53, 24 July 2008 (UTC)
- MBisanz... I've mentioned the consensus against the box diagram several times. Have you read through the RFC and previous discussions on this diagram? Can you comment on this? Mrshaba (talk) 15:47, 24 July 2008 (UTC)
- Yes, I've seen those discussions, ideally we can find a way to present that information, somewhere, in some form, that everyone can agree on. On a related note, is there any rule an article must have a lead image? Maybe this subject is too complex to have one image or even a collage of images represent it. MBisanz talk 16:16, 24 July 2008 (UTC)
- Do you think there has been a consensus against the box diagram? As others have noted the information is text based. Mrshaba (talk) 16:22, 24 July 2008 (UTC)
- There certainly is no rule that an article must have a lead image that I am aware of. Then again this is Wikipedia, which has no rules. Just a goal of creating a free encyclopedia, a goal which it is felt has irrevocably been accomplished. The entire MOS is a guideline, not a policy. Apteva (talk) 16:50, 24 July 2008 (UTC)
- Yes, I've seen those discussions, ideally we can find a way to present that information, somewhere, in some form, that everyone can agree on. On a related note, is there any rule an article must have a lead image? Maybe this subject is too complex to have one image or even a collage of images represent it. MBisanz talk 16:16, 24 July 2008 (UTC)
- MBisanz... I've mentioned the consensus against the box diagram several times. Have you read through the RFC and previous discussions on this diagram? Can you comment on this? Mrshaba (talk) 15:47, 24 July 2008 (UTC)
- Seeing as some of the parties are going on break for a bit, and right now there is no disputed picture in the article lead (since there is no picture in the lead), lets put this on hold for a month or so until we have more voices to address the matters. And maybe I'll get aorund to figuring out how to make a solar-themed graph. MBisanz talk 01:22, 27 July 2008 (UTC)
Mediation in general[edit]
A workshop on communication posits that the only two things anyone ever says are Please and Thank you, and that what most gets in the way of getting what we want are Criticism and Demands. I certainly always laugh when I hear someone on WP making a demand. However, it seems that the criticisms don't help either. Now which was this, Please or Thank you? Apteva (talk) 17:54, 24 July 2008 (UTC)
Recommend closing this RfM[edit]
As a newcomer to this article on behalf of The FA-Team, I have been rather disappointed to discover this extensive procedure devoted to discussing what image should go in the lead. There seems to be a failure to appreciate that mediation in Wikipedia is different from mediation in real life: in real life the goal is to reach a compromise which leaves all parties happy, or at least unaggrieved; in Wikipedia, the goal is to improve the encyclopedia, in accordance with the pillars and policy that describe what a good encyclopedia should look like.
Two of Wikipedia's core policies, WP:NOR and WP:NPOV, immediately inform this discussion. As Itsmejudith has noted more than once in this thread, "we are here to describe solar energy, not to promote it.". Global warming is a serious issue and optmizing use of solar energy is an important part of addressing it. However, Wikipedia's role is purely to provide information, not to advocate actions, issues or remedies.
When I first read the article I drafted a comment saying that if it came up for good article reassessment I might slam it for advocacy. I decided my comment was exaggerated and discouraging and did not post it. At the time the image caption of the box image read "solar energy (left) greatly exceeds total global energy consumption (right)". A good editor independently noticed and made the caption more neutral, but the image still presents an unsourced, non-neutral point of view by comparing chalk with cheese: total incident solar radiation and global energy consumption. This totally confuses issues: the basic physics of global warming is that not enough incident solar energy is being radiated into space! The image should not even be in the article, let alone the lead.
The related dot image is not much better. Taken from what appears to be a self-published source, it presents irrelevant statistics in a random way, suggesting a much greater use of photovoltaics as a solution to global energy problems. Maybe, but our policies do not support including images like these in our articles unless reliable secondary sources present similar information in similar ways. There seems to have been a complete failure here to take policy into account, perhaps in a misguided attempt to make everyone happy. When one party is advocating images which violate policy, they are not going to be happy with the outcome. That is life on Wikipedia.
I recommend closing this RfM and letting editors get on with improving the article. Geometry guy 21:15, 30 July 2008 (UTC)
- This is a good outside view that works within policy, hopefully when the other parties return we can take some of this advice and work it into an image decision, or maybe the FA Team will lend a hand and help reach a consensus on the best representative image, thanks again! MBisanz talk 01:20, 6 August 2008 (UTC)
- Judith and I share the same view. Just about everyone shares the same view. These pictures have dragged down the page for long enough so make a decision. This is a poor example of how wikipedia works. Mrshaba (talk) 05:49, 6 August 2008 (UTC)
- Using the words "dragged down" just supports the view that you don't want solar to compete with nuclear power. But we can pick this up in September. Face it, there is a thousand times more solar energy available than there ever will be from nuclear. Apteva (talk) 14:54, 6 August 2008 (UTC)
- The article now has an image of a solar energy technology in the lead, which is what Apteva wanted in the first place. I am not against this. I am against images which damage the article's quality and neutrality because they are OR by synthesis, and promote a point of view. That is what "dragged down" means.
- In the debate over the merits of solar and/or nuclear energy, Wikipedia must be scrupulously neutral. There is no place here for editing (however well meaning) which advocates a point of view. This comment by Apteva is reminiscent of this unfortunate discussion. I see no evidence that Mrshaba's edits are motivated by advocacy. I cannot say the same for Apteva and the 199.125.109... IPs. Geometry guy 22:00, 6 August 2008 (UTC)
- Using the words "dragged down" just supports the view that you don't want solar to compete with nuclear power. But we can pick this up in September. Face it, there is a thousand times more solar energy available than there ever will be from nuclear. Apteva (talk) 14:54, 6 August 2008 (UTC)
- Judith and I share the same view. Just about everyone shares the same view. These pictures have dragged down the page for long enough so make a decision. This is a poor example of how wikipedia works. Mrshaba (talk) 05:49, 6 August 2008 (UTC)
- Well at this point I think we've found a nice, free, image that incorporates the main points of solar energy in it and meets WP's other guidelines. Any objections to closing this early next week? MBisanz talk 00:06, 17 August 2008 (UTC)
malfunctioning solar panels[edit]
Has anyone had malfunctioning solar panels removed? I had problems with mine and I have been advised to complain to the company that installed them and the bank that financed the loan to have them removed. The bank replied to say they would get back to me after investigating the issue with the installing company. The solar company are saying they will compensate for the inconvinience but that taking the solar panels off is not an option. I am very frustrated by the whole thing. I really want these panels off since they stopped working in February and couldnt get them to fix the problem untill I wrote to them and the bank in July asking that the panels be removed. What are my rights (Dumelani49 (talk) 16:55, 14 September 2014 (UTC)).
- @Dumelani49: hi there. I appreciate your concern, but Wikipedia isn't the place to ask about things like this. George8211 / T 17:04, 14 September 2014 (UTC)
- ^ The volume of each cube represents the amount of energy available and consumed. The amount of solar energy available to the earth in one hour exceeds global energy demand for a year.Energy and Inspiration: Inventing the Future in Time
- ^ Smil (2006), p. 12
- ^ Archer, Cristina. "Evaluation of Global Wind Power". Stanford. Retrieved 2008-06-03.
{{cite web}}: Unknown parameter|coauthor=ignored (|author=suggested) (help) - ^ "Energy conversion by photosynthetic organisms". Food and Agriculture Organization of the United Nations. Retrieved 2008-05-25.
- ^ "World Total Net Electricity Consumption, 1980-2005". Energy Information Administration. Retrieved 2008-05-25.
- ^ "World Consumption of Primary Energy by Energy Type and Selected Country Groups, 1980-2004". Energy Information Administration. Retrieved 2008-05-17.