1917 Western Australian state election
| ||||||||||||||||||||||||||||
All 50 seats in the Western Australian Legislative Assembly | ||||||||||||||||||||||||||||
|---|---|---|---|---|---|---|---|---|---|---|---|---|---|---|---|---|---|---|---|---|---|---|---|---|---|---|---|---|
| ||||||||||||||||||||||||||||
| ||||||||||||||||||||||||||||
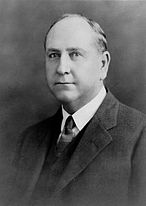
Elections were held in the state of Western Australia on 29 September 1917 to elect 50 members to the Western Australian Legislative Assembly. The Nationalist-Country-National Labor coalition, led by Premier Sir Henry Lefroy, retained government against the Labor Party led by Opposition Leader Philip Collier. The election followed a series of major changes in the Western Australian political landscape.
Results
As the political changes were of a nature which make direct comparison meaningless, no vote swings have been included, and seat swings indicated are those caused by the election itself, rather than a comparison with the previous election. The National Liberal grouping was not a party in its own right, but a faction within the Nationalist Party, so the Nationalist Party as a whole held 16 seats—unchanged from before the election—and attracted 34.85% of the vote.
|
1917 Western Australian state election | ||||||
|---|---|---|---|---|---|---|
| Enrolled voters | 138,115[1] | |||||
| Votes cast | 85,620 | Turnout | 61.99% | +4.67% | ||
| Informal votes | 1,447 | Informal | 1.69% | +0.50% | ||
| Summary of votes by party | ||||||
| Party | Primary votes | % | Swing | Seats | Change | |
| Labor | 20,867 | 24.79% | 15 | + 1 | ||
| Nationalist | 18,087 | 21.49% | 8 | + 3 | ||
| National Liberal | 11,242 | 13.36% | 8 | – 3 | ||
| Country | 15,560 | 18.49% | 12 | + 1 | ||
| National Labor | 13,186 | 15.67% | 6 | – 3 | ||
| Independent Labor WA | 2,490 | 2.96% | 1 | + 1 | ||
| Independent | 2,709 | 3.22% | 0 | ± 0 | ||
| Total | 84,173 | 50 | ||||
Notes:
- 1 A total of 167,311 people were enrolled to vote at the election, but 10 of the 50 seats, representing 29,196 voters, were not contested by more than one candidate. Six of these were Labor seats, two were Country Party, one was Nationalist and one was National Labor.
See also
- Members of the Western Australian Legislative Assembly, 1914–1917
- Members of the Western Australian Legislative Assembly, 1917–1921


