
Barcode

A barcode is an optical machine-readable representation of data, which shows certain data on certain products. Originally, barcodes represented data in the widths (lines) and the spacings of parallel lines, and may be referred to as linear or 1D (1 dimensional) barcodes or symbologies. They also come in patterns of squares, dots, hexagons and other geometric patterns within images termed 2D (2 dimensional) matrix codes or symbologies. Although 2D systems use symbols other than bars, they are generally referred to as barcodes as well. Barcodes can be read by optical scanners called barcode readers, or scanned from an image by special software.
The first use of barcodes was to label railroad cars, but they were not commercially successful until they were used to automate supermarket checkout systems, a task in which they have become almost universal. Their use has spread to many other roles as well, tasks that are generically referred to as Auto ID Data Capture (AIDC). Other systems are attempting to make inroads in the AIDC market, but the simplicity, universality and low cost of barcodes has limited the role of these other systems. It costs 0.5¢ (U.S.) to implement a barcode, while passive RFID still costs about 7¢ to 30¢ per tag.[1]
History
In 1948 Bernard Silver, a graduate student at Drexel Institute of Technology in Philadelphia, USA overheard the president of the local food chain, Food Fair, asking one of the deans to research a system to automatically read product information during checkout.[2] Silver told his friend Norman Joseph Woodland about the request, and they started working on a variety of systems. Their first working system used ultraviolet ink, but this proved to fade and was fairly expensive.[3]
Convinced that the system was workable with further development, Woodland quit his position at Drexel, moved into his father's apartment in Florida, and continued working on the system. His next inspiration came from Morse code, and he formed his first barcode from sand on the beach when "I just extended the dots and dashes downwards and made narrow lines and wide lines out of them."[3] To read them, he adapted technology from optical soundtracks in movies, using a 500-watt light bulb shining through the paper onto an RCA935 photomultiplier tube (from a movie projector) on the far side. He later decided that the system would work better if it were printed as a circle instead of a line, allowing it to be scanned in any direction.
On 20 October 1949 Woodland and Silver filed a patent application for "Classifying Apparatus and Method", in which they described both the linear and bullseye printing patterns, as well as the mechanical and electronic systems needed to read the code. The patent was issued on 7 October 1952 as US Patent 2,612,994. In 1951, Woodland moved to IBM and continually tried to interest IBM in developing the system. The company eventually commissioned a report on the idea, which concluded that it was both feasible and interesting, but that processing the resulting information would require equipment that was some time off in the future.
In 1952 Philco purchased their patent, and then sold it to RCA the same year. In 1963 Silver died in a car accident.
Collins at Sylvania
During his time as an undergraduate, David Collins worked at the Pennsylvania Railroad and became aware of the need to automatically identify train cars. Immediately after receiving his master's degree from MIT in 1959, he started work at Sylvania and began addressing the problem. He developed a system using blue and yellow reflective stripes attached to the side of the cars, encoding a six-digit company identifier and a four-digit car number.[3] Light reflected off the stripes was fed into one of two photomultipliers, filtered for blue or yellow.[citation needed]
The Boston and Maine Railroad tested the system on their gravel cars in 1961. The tests continued until 1967, when the Association of American Railroads (AAR) selected it as a standard across the entire North American fleet. The installations began on October 10, 1967. However, the economic downturn and rash of bankruptcies in the industry in the early 1970s greatly slowed the rollout, and it wasn't until 1974 that 95% of the fleet was labeled. To add to its woes, the system was found to be easily fooled by dirt in certain applications, and the accuracy was greatly affected. The AAR abandoned the system in the late 1970s, and it was not until the mid-1980s that they introduced a similar system, this time based on radio tags.[citation needed]
The railway project had proven to be a bust, but a toll bridge in New Jersey requested that a similar system be developed so that it could quickly scan for cars that had paid for a monthly pass. Then the U.S. Post Office requested the development of a system to keep track of the trucks entering and leaving their facilities. These applications required special retroreflective labels. Finally, Kal Kan asked the Sylvania team to develop a simpler (and cheaper) version which they could put on cases of pet food for inventory control. This, in turn, led to the grocery industry's interest.[citation needed]
Computer Identics Corporation
In 1967, with the railway system maturing, Collins went to management looking for funding for a project to develop a black and white version of the code for other industries. They declined, saying that the railway project was large enough and they saw no need to branch out so quickly.
Collins then quit Sylvania and formed Computer Identics Corporation.[3] Computer Identics started working with helium-neon lasers in place of light bulbs, scanning with a mirror to locate the barcode anywhere up to several feet in front of the scanner. This made the entire process much simpler and more reliable, as well as allowing it to deal with ripped codes by reading the intact portions.
Computer Identics Corporation installed one of its first two scanning system in the spring of 1969 at a General Motors (Buick) factory in Flint, Michigan.[3] The system was used to identify a dozen different types of transmissions moving on an overhead conveyor from production to shipping. The other scanning system was installed at General Trading Company's distribution center in Carlsbad, New Jersey to direct shipments to the proper loading-bay doors.
UPC
In 1966 the National Association of Food Chains (NAFC) held a meeting where they discussed the idea of using automated checkout systems. RCA, having purchased rights to the original Woodland patent, had attended the meeting and set up an internal project to develop a system based on the bullseye code. The Kroger grocery chain volunteered to test it.
In mid-1970, the NAFC established the U.S. Supermarket Ad Hoc Committee on a Uniform Grocery Product Code, which set guidelines for barcode development and created a symbol selection subcommittee to help standardize the approach. In cooperation with consulting firm McKinsey & Co., they developed a standardized 11-digit code to identify any product. The committee then sent out a contract tender to develop a barcode system to print and read the code. The request went to Singer, National Cash Register (NCR), Litton Industries, RCA, Pitney-Bowes, IBM and many others.[4] A wide variety of barcode approaches were studied, including linear codes, RCA's bullseye concentric circle code, systems with starburst patterns, and even odder varieties.
In the spring of 1971 RCA demonstrated their bullseye code at another industry meeting, and IBM executives at the meeting noticed the crowds at the RCA booth, immediately setting out to develop their own system. IBM marketing specialist Alec Jablonover remembered that the company still employed the system's inventor Woodland, and he was set up in new facilities in North Carolina to lead the development.
In July 1972 RCA began an eighteen-month test of their system in a Kroger store in Cincinnati. Barcodes were printed on small pieces of adhesive paper, and attached by hand by store employees when they were adding price tags. The code proved to have a serious problem. During printing, presses sometimes smear ink in the direction the paper is running, rendering the code unreadable in most orientations. A linear code, like the one being developed by Woodland at IBM, however, was printed in the direction of the stripes, so extra ink simply makes the code "taller" while remaining readable, and on April 3, 1973 the IBM UPC code was selected by NAFC as their standard. IBM had designed five versions of the UPC symbology for future industry requirements: UPC A, B, C, D, and E.[5]
NCR installed a testbed system at Marsh's Supermarket in Troy, Ohio, USA near the factory that was producing the equipment. On June 26, 1974, Clyde Dawson pulled a 10-pack of Wrigley's Juicy Fruit gum out of his basket and it was scanned by Sharon Buchanan at 8:01 am. The pack of gum and the receipt are now on display in the Smithsonian Institution. It was the first commercial appearance of the UPC.[6]
Economic studies conducted for the grocery industry committee projected over $40 million in savings to the industry from scanning by the mid-1970s. Those numbers were not achieved in that time frame and there were those who predicted the demise of barcode scanning. The usefulness of the barcode required the adoption of expensive scanners by a critical mass of retailers while manufacturers simultaneously adopted barcode labels. Neither wanted to move first and results weren't promising for the first couple of years, with Business Week proclaiming "The Supermarket Scanner That Failed."[6]
For years many had worked to computerize the grocery industry. In 1971 IBM had assembled a team for an intensive planning session, day after day, 12 to 18 hours a day, to hash out how the whole system might operate and to schedule a rollout plan. By 1973 they were meeting with grocery manufacturers to introduce the symbol that would need to be printed on all of their products. There were no cost savings for a grocery to use it unless at least 70% of the grocery's products had the barcode printed on the product by the manufacturer. IBM was projecting that 75% would be in 1975. Even though that was achieved, there still were scanning machines in fewer than 200 grocery stores by 1977.[7]
Experience with barcode scanning in those stores revealed benefits previously unappreciated. The detailed sales information acquired by the new systems allowed far better servicing of customer needs. This was reflected in the fact that about 5 weeks after installing barcode scanners, sales in grocery stores typically started climbing and eventually leveled off at a 10-12% increase in sales that never dropped off. There also was a 1% to 2% decrease in operating cost for the stores that enabled them to lower prices in order to increase market share. It was shown in the field that the return on investment for a barcode scanner was 41.5%. By 1980 the technology was being adopted by 8000 stores per year.[7]
The global public launch of the barcode was greeted with minor skepticism from conspiracy theorists, who considered barcodes to be an intrusive surveillance technology, and from some Christians who thought the codes hid the number 666, representing the antichrist. Television host Phil Donahue described barcodes as a "corporate plot against consumers".[8]
Industrial adoption
In 1981 the United States Department of Defense adopted the use of Code 39 for marking all products sold to the United States military. This system, LOGMARS, is still used by DoD and is widely viewed as the catalyst for widespread adoption of barcoding in industrial applications.[9]
Use
Barcodes—especially the UPC—have slowly become an essential[citation needed] part of modern civilization. Their use is widespread, and the technology behind barcodes is constantly improving. Some modern applications of barcodes include:
- Almost every item purchased from a grocery store, department store, and mass merchandiser has a UPC barcode on it.[citation needed] This greatly helps in keeping track of a large number of items in a store and also reduces instances of shoplifting involving price tag swapping, although shoplifters can now print their own barcodes.[citation needed] Since the adoption of barcodes, both consumers and retailers have benefited from the savings generated.
- Barcodes are widely used in shop floor control applications software where employees can scan work orders and enter the time spent on a job.[10]
- Retail chain membership cards (issued mostly by grocery stores and specialty "big box" retail stores such as sporting equipment, office supply, or pet stores) use bar codes to uniquely identify a consumer. Retailers benefit by being able to offer customized marketing and greater understanding of individual consumer shopping patterns. Shoppers typically get special offers at the point of sale (coupons, product discounts) or special marketing offers through the address or e-mail address provided at registration.

- When used on patient identification, barcodes permit clinical staff to instantly access a wealth of vital patient data, including medical history, allergy warnings and other potentially life-saving medical information.
- Document Management tools often allow for barcoded sheets to facilitate the separation and indexing of documents that have been imaged in batch scanning applications.

- The tracking of item movement, including rental cars, airline luggage, nuclear waste, mail, express mail and parcels.
- In 2003 Paul Hebert suggested using bar coding techniques for organization of species. The barcode assigned is based on the CO1 gene.[11]
- Since 2005, airlines use an IATA-standard 2D barcode on boarding passes (BCBP), and since 2008 2D barcodes sent to mobile phones enable electronic boarding passes.[12]
- Recently, researchers have placed tiny barcodes on individual bees to track the insects' mating habits.
- Entertainment event tickets can have barcodes that need to be validated before allowing the holder to enter sports arenas, cinemas, theatres, fairgrounds, transportation etc. This can allow the proprietor to identify duplicate or fraudulent tickets more easily.
- Used on automobiles, can be located on front or back.
- Joined with in-motion checkweighers to identify the item being weighed in a conveyor line for data collection
- Some 2D barcodes embed a hyperlink to a web page. A capable cellphone might be used to read the barcode and browse the linked website.
- In the 1970s and 1980s, software source code was occasionally encoded in a barcode and printed on paper. Cauzin Softstrip and Paperbyte[13] are barcode symbologies specifically designed for this application.
- The 1991 Barcode Battler computer game system, which used any standard barcode to generate combat statistics.
- 1992, Veterans Health Administration developed Bar Code Medication Administration system (BCMA).
- In the 21st century many artists started using barcodes in art, such as Scott Blake's Barcode Jesus, as part of the post-modernism movement.
- Today, barcodes are issued by GS1, the most widely used supply chain standards system in the world.[14]
Symbologies
The mapping between messages and barcodes is called a symbology. The specification of a symbology includes the encoding of the single digits/characters of the message as well as the start and stop markers into bars and space, the size of the quiet zone required to be before and after the barcode as well as the computation of a checksum.
Linear symbologies can be classified mainly by two properties:
- Continuous vs. discrete: Characters in continuous symbologies usually abut, with one character ending with a space and the next beginning with a bar, or vice versa. Characters in discrete symbologies begin and end with bars; the intercharacter space is ignored, as long as it is not wide enough to look like the code ends.
- Two-width vs. many-width: Bars and spaces in two-width symbologies are wide or narrow; how wide a wide bar is exactly has no significance as long as the symbology requirements for wide bars are adhered to (usually two to three times wider than a narrow bar). Bars and spaces in many-width symbologies are all multiples of a basic width called the module; most such codes use four widths of 1, 2, 3 and 4 modules.
Some symbologies use interleaving. The first character is encoded using black bars of varying width. The second character is then encoded, by varying the width of the white spaces between these bars. Thus characters are encoded in pairs over the same section of the barcode. Interleaved 2 of 5 is an example of this.
Stacked symbologies consist of a given linear symbology repeated vertically in multiple.
There is a large variety of 2D symbologies. The most common are matrix codes, which feature square or dot-shaped modules arranged on a grid pattern. 2-D symbologies also come in a variety of other visual formats. Aside from circular patterns, there are several 2-D symbologies which employ steganography by hiding an array of different-sized or -shaped modules within a user-specified image (for example, DataGlyphs).
Linear symbologies are optimized to be read by a laser scanner, which sweeps a beam of light across the barcode in a straight line, reading a slice of the barcode light-dark patterns. In the 1990s development of CCD imagers to read barcodes was pioneered by Welch Allyn. Imaging does not require moving parts, like a laser scanner does. In 2007, linear imaging was surpassing laser scanning as the preferred scan engine for its performance and durability.
Stacked symbologies are also optimized for laser scanning, with the laser making multiple passes across the barcode.
2-D symbologies cannot be read by a laser as there is typically no sweep pattern that can encompass the entire symbol. They must be scanned by an image-based scanner employing a charge coupled device (CCD) or other digital camera sensor technology.
Scanners (barcode readers)
The earliest, and still the cheapest, barcode scanners are built from a fixed light and a single photosensor that is manually "scrubbed" across the barcode.
Barcode scanners can be classified into three categories based on their connection to the computer. The older type is the RS-232 barcode scanner. This type requires special programming for transferring the input data to the application program. Another type connects between a computer and its PS/2 or AT keyboard by the use of an adaptor cable. The third type is the USB barcode scanner, which is a more modern and more easily installed device than the RS-232 scanner. Like the keyboard interface scanner, this has the advantage that it does not need any code or program for transferring input data to the application program; when you scan the barcode its data is sent to the computer as if it had been typed on the keyboard.
Verifier (Pika inspection)
Barcode verifiers are primarily used by businesses that print barcodes and use barcodes. Any trading partner in the supply chain could test barcode quality. It is important to "grade" a barcode to ensure that any scanner in the supply chain can read the barcode. Retailers levy large fines and penalties for non-compliant barcodes.
Barcode verifiers work in a way similar to a scanner but instead of simply decoding a barcode, a verifier performs a series of eight tests. Each test is given a grade from 0.0 to 4.0 (F to A) and the lowest of any of the tests is the scan grade. For most applications a 2.5 (C) grade is the minimum acceptable grade.
In difference to a scanner a verifier shall measure a barcode. The measurement shall be repeatable. This requires constant conditions like distance, illumination angle, sensor angle and aperture of the verifier. If these conditions are variable also the result of the verifier will vary. If comparing to a scanner then a scanner has the purpose to read a barcode as efficient as possible under variable conditions as possible.
The reason of using barcodes is to make processes faster, more reliable and cheaper. To achieve this the print quality of the bar code shall as perfect as possible and the scanner technology shall read as efficient as possible. If both sides are working perfect the target of improving processes is reached. If not the investment in the technology does not pay back as it could and should.
Barcode verifier standards:
- Barcode verifiers should comply with the ISO/IEC 15426-1 (linear barcode verifier compliance standard) or ISO/IEC 15426-2 (2D barcode verifier compliance standard)
This defines the measuring accuracy of a bar code verifier
- The current international barcode quality specification is ISO/IEC 15416 (linear barcodes) and ISO/IEC 15415 (2D barcodes)
This defines the quality demands to barcodes and Matrix Codes (common name Optical Codes)
- The European Standard EN 1635 has been withdrawn and replaced by ISO/IEC 15416
- The original U.S. barcode quality specification was ANSI X3.182. UPC Codes used in the US ANSI/UCC5.
- Currently under work at the ISO workgroup JTC1 SC31 is a DPM quality standard : ISO/IEC TR 29158
http://www.iso.org/iso/iso_technical_committee.html?commid=45332
The international standards are available at the International Organisation for Standardization http://www.iso.org/iso/home.html
At the local standardisation organisation these standards are also available (ANSI, BSI, DIN, NEN etc.)
Benefits
In point-of-sale management, the use of barcodes can provide very detailed up-to-date information on key aspects of the business, enabling decisions to be made much more quickly and with more confidence. For example:
- Fast-selling items can be identified quickly and automatically reordered to meet consumer demand,
- Slow-selling items can be identified, preventing a build-up of unwanted stock,
- The effects of repositioning a given product within a store can be monitored, allowing fast-moving more profitable items to occupy the best space,
- Historical data can be used to predict seasonal fluctuations very accurately.
- Items may be repriced on the shelf to reflect both sale prices and price increases.
- This technology also enables the profiling of individual consumers, typically through a voluntary registration of discount cards. While pitched as a benefit to the consumer, this practice is considered to be potentially dangerous by privacy advocates.
Besides sales and inventory tracking, barcodes are very useful in shipping/receiving/tracking.
- When a manufacturer packs a box with any given item, a Unique Identifying Number (UID) can be assigned to the box.
- A relational database can be created to relate the UID to relevant information about the box; such as order number, items packed, qty packed, final destination, etc.
- The information can be transmitted through a communication system such as Electronic Data Interchange (EDI) so the retailer has the information about a shipment before it arrives.
- Shipments that are sent to a Distribution Center (DC) are tracked before being forwarded to the final destination. When the shipment gets to the final destination, the UID gets scanned, so the store knows where the order came from, what's inside the box, and how much to pay the manufacturer.
The reason barcodes are business-friendly is that the scanners are relatively low cost and extremely accurate compared to key-entry, with only about 1 substitution error in 15,000 to 36 trillion characters entered.[15][unreliable source?] The exact error rate depends on the type of barcode.
Types of barcodes
Linear barcodes
| Symbology | Continuous or discrete |
Bar widths | Uses |
|---|---|---|---|
| U.P.C. | Continuous | Many | Worldwide retail, GS1-approved |
| Codabar | Discrete | Two | Old format used in libraries and blood banks and on airbills |
| Code 25 – Non-interleaved 2 of 5 | Continuous | Two | Industrial (NO) |
| Code 25 – Interleaved 2 of 5 | Continuous | Two | Wholesale, libraries (NO) |
| Code 39 | Discrete | Two | Various |
| Code 93 | Continuous | Many | Various |
| Code 128 | Continuous | Many | Various |
| Code 128A | Continuous | Many | Various |
| Code 128B | Continuous | Many | Various |
| Code 128C | Continuous | Many | Various |
| Code 11 | Discrete | Two | Telephones |
| CPC Binary | Discrete | Two | |
| DUN 14 | Continuous | Many | Various |
| EAN 2 | Continuous | Many | Addon code (magazines), GS1-approved |
| EAN 5 | Continuous | Many | Addon code (books), GS1-approved |
| EAN 8, EAN 13 | Continuous | Many | Worldwide retail, GS1-approved |
| Facing Identification Mark | Continuous | One | USPS business reply mail |
| GS1-128 (formerly known as UCC/EAN-128), incorrectly referenced as EAN 128 and UCC 128 | Continuous | Many | various, GS1-approved |
| GS1 DataBar, formerly Reduced Space Symbology (RSS) | Continuous | Many | Various, GS1-approved |
| HIBC (HIBCC Health Industry Bar Code) | [16] | ||
| ITF-14 | Continuous | Many | Non-retail packaging levels, GS1-approved |
| Latent image barcode | Neither | Tall/short | Color print film |
| Pharmacode | Neither | Two | Pharmaceutical packaging |
| Plessey | Continuous | Two | Catalogs, store shelves, inventory |
| PLANET | Continuous | Tall/short | United States Postal Service |
| POSTNET | Continuous | Tall/short | United States Postal Service |
| Intelligent Mail barcode | Continuous | Tall/short | United States Postal Service, replaces both POSTNET and PLANET symbols (previously known as OneCode) |
| MSI | Continuous | Two | Used for warehouse shelves and inventory |
| PostBar | Discrete | Many | Canadian Post office |
| RM4SCC / KIX | Continuous | Tall/short | Royal Mail / Royal TPG Post |
| JAN | Continuous | Many | Used in Japan, similar and compatible with EAN-13 |
| Telepen | Continuous | Two | Libraries (UK) |
Matrix (2D) barcodes
A matrix code, also known as a 2D barcode or simply a 2D code, is a two-dimensional way of representing information. It is similar to a linear (1-dimensional) barcode, but has more data representation capability.
| Symbology | Notes |
|---|---|
| 3-DI | Developed by Lynn Ltd. |
| ArrayTag | From ArrayTech Systems. |
| Aztec Code | Designed by Andrew Longacre at Welch Allyn (now Hand Held Products). Public domain. |
| Small Aztec Code | Space-saving version of Aztec code. |
| Chromatic Alphabet[17] | an artistic proposal by C. C. Elian; divides the visible spectrum into 26 different wavelengths - hues. |
| Chromocode | uses black, white, and 4 saturated colors.[18] |
| Codablock | Stacked 1D barcodes. |
| Code 1 | Public domain. |
| Code 16K | Based on 1D Code 128. |
| Code 49 | Stacked 1D barcodes from Intermec Corp. |
| ColorCode | ColorZip[19] developed colour barcodes that can be read by camera phones from TV screens; mainly used in Korea.[20] |
| Compact Matrix Code | From Syscan Group, Inc. |
| CP Code | From CP Tron, Inc. |
| CyberCode | From Sony. |
| d-touch | readable when printed on deformable gloves and stretched and distorted[21] |
| DataGlyphs | From Palo Alto Research Center (also known as Xerox PARC).[22] |
| Datamatrix | From Microscan Systems, formerly RVSI Acuity CiMatrix/Siemens. Public domain. Increasingly used throughout the United States. Single segment Datamatrix is also known as Semacode. |
| Datastrip Code | From Datastrip, Inc. |
| Dot Code A | Designed for the unique identification of items. |
| EZcode | Designed for decoding by cameraphones.[23] |
| Grid Matrix Code | From Syscan Group, Inc. |
| High Capacity Color Barcode | Developed by Microsoft; licensed by ISAN-IA. |
| HueCode | From Robot Design Associates. Uses greyscale or colour.[24] |
| INTACTA.CODE | From INTACTA Technologies, Inc. |
| InterCode | From Iconlab, Inc. The standard 2D barcode in South Korea. All 3 South Korean mobile carriers put the scanner program of this code into their handsets to access mobile internet, as a default embedded program. |
| JAGTAG | From JAGTAG, Inc. Optimized for use with mobile device cameras. |
| MaxiCode | Used by United Parcel Service. Now Public Domain |
| mCode | Developed by Nextcode Corporation specifically for camera phone scanning applications. Designed to enable advanced cell mobile applications with standard camera phones. |
| MiniCode | From Omniplanar, Inc. |
| Micro PDF417 | Facilitates codes too small to be used in PDF417. |
| MMCC | Designed to disseminate high capacity mobile phone content via existing colour print and electronic media, without the need for network connectivity |
| Nintendo e-Reader#Dot code | Developed by Olympus Corporation to store songs, images, and mini-games for Game Boy Advance on Pokémon trading cards. |
| Optar | Developed by Twibright Labs and published as free software. Aims at maximum data storage density, for storing data on paper. 200kB per A4 page with laser printer. |
| PaperDisk | High density code, used both for data heavy applications (10K – 1 MB) and camera phones (50+ bits). Developed and patented by Cobblestone Software.[25] |
| PDF417 | Originated by Symbol Technologies. Public Domain. |
| PDMark | Developed by Ardaco. |
| QR Code | Initially developed, patented and owned by Toyota subsidiary Denso Wave for car parts management; now public domain. Can encode Japanese Kanji and Kana characters, music, images, URLs, emails. De facto standard for Japanese cell phones. Also used with BlackBerry Messenger to pickup contacts rather than using a PIN code. These codes are also used frequently for Android OS phones. |
| QuickMark Code | From SimpleAct Inc.[26] |
| SmartCode | From InfoImaging Technologies. |
| Snowflake Code | From Marconi Data Systems, Inc. |
| ShotCode | Circular barcodes for camera phones by OP3. Originally from High Energy Magic Ltd in name Spotcode. Before that probably known as TRIPCode. |
| SPARQCode | QR Code encoding standard from MSKYNET, Inc. |
| SuperCode | Public domain. |
| Trillcode | From Lark Computers. Designed to work with mobile device's camera or webcam PC. Can encode a variety of "actions". |
| UltraCode | Black-and-white & colour versions. Public domain. Invented by Jeffrey Kaufman and Clive Hohberger. |
| UnisCode | also called "Beijing U Code"; a colour 2D barcode developed by Chinese company UNIS |
| VeriCode, VSCode | From Veritec, Inc. |
| WaterCode | High-density 2D Barcode(440 Bytes/cm2) From MarkAny Inc. |
Example images
- First, Second and Third Generation Barcodes
-
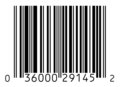 GTIN-12 number encoded in UPC-A barcode symbol. First and last digit are always placed outside the symbol to indicate Quiet Zones that are necessary for barcode scanners to work properly
 -
 EAN-13 (GTIN-13) number encoded in EAN-13 barcode symbol. First digit is always placed outside the symbol, additionally right quiet zone indicator (>) is used to indicate Quiet Zones that are necessary for barcode scanners to work properly
 -
 "Wikipedia" encoded in Code 93
 -
 'Wikipedia" encoded in Code 128
 -
 PDF417 sample
 -
 Lorem ipsum boilerplate text as four segment DataMatrix 2D
 -
 "This is an example Aztec symbol for Wikipedia" encoded in Aztec Code
 -
 Text 'EZcode'
 -
 High Capacity Color Barcode of the URL for Wikipedia's article on High Capacity Color Barcode
 -
 "Wikipedia, The Free Encyclopedia" in several languages encoded in DataGlyphs
 -
 Two different 2D barcodes used in film: Dolby Digital between the sprocket holes with the "Double-D" logo in the middle, and Sony Dynamic Digital Sound in the blue area to the left of the sprocket holes
 -
![The QR Code for the Wikipedia URL. "Quick Response", the most popular 2D barcode in Japan, is promoted by Google. It is open in that the specification is disclosed and the patent is not exercised.[27]](//upload.wikimedia.org/wikipedia/commons/thumb/c/ce/WikiQRCode.png/120px-WikiQRCode.png)
-
 MaxiCode example. This encodes the string "Wikipedia, The Free Encyclopedia"
 -
 ShotCode sample
 -
 detail of Twibright Optar scan from laser printed paper, carrying 32kbps Ogg Vorbis digital music (48 seconds per A4 page)


![The QR Code for the Wikipedia URL. "Quick Response", the most popular 2D barcode in Japan, is promoted by Google. It is open in that the specification is disclosed and the patent is not exercised.[27]](/wiki/File:WikiQRCode.png)


See also
- Automated identification and data capture (AIDC)
- Barcode printer
- Barcode scanner
- BCBP (Bar Coded Boarding Passes)
- Bokode
- Code (disambiguation)
- Data Matrix
- European Article Number (EAN)
- European Article Numbering-Uniform Code Council
- Global Trade Item Number
- Identifier
- Inventory control system
- ISBN
- Physical world hyperlinks
- RFID
- Semacode
- Sms barcode
- SPARQCode
- Supply Chain Management
- Universal Product Code (UPC)
References
Notes
- ^ Some Hot North American RFID Applications, rfidradio.com
- ^ Fishman, Charles (August 1, 2001). "The Killer App - Bar None". American Way. Retrieved 2010-04-19.
- ^ a b c d e Tony Seideman, "Barcodes Sweep the World", barcoding.com Wonders of Modern Technology
- ^ George Laurer, "Development of the U.P.C. Symbol", bellsouthpwp.net
- ^ Nelson, Benjamin (1997). "From Punched Cards To Bar Codes".
{{cite journal}}: Cite journal requires|journal=(help) - ^ a b Varchaver, Nicholas (2004-05-31). "Scanning the Globe". Fortune. Retrieved 2006-11-27.
- ^ a b Selmeier, Bill (2008). Spreading the Barcode. pp. 26, 214, 236, 238, 244, 245, 236, 238, 244, 245. ISBN 978-0-578-02417-2.
- ^ Bishop, Tricia (July 5, 2004). "UPC bar code has been in use 30 years". SFgate.com. Retrieved 22 December 2009.
- ^ Adams1.com
- ^ Expedimedia.com, How to use barcode
- ^ National Geographic, May 2010, page 30
- ^ IATA.org
- ^ "Paperbyte Bar Codes for Waduzitdo" Byte magazine, 1978 September p. 172
- ^ "The global language of business". GS1.org. Retrieved 31 August 2010.
- ^ Harmon and Adams(1989). Reading Between The Lines, p.13. Helmers Publishing, Inc, Peterborough, New Hampshire, USA. ISBN 0911261001.
- ^ FDA.gov, Health Industry Bar Code (HIBC) supplier labeling standard
- ^ Chromatic Alphabet by C. C. Elian. The Elian Script, ccelian.com
- ^ Chromocode ... Multicolor / Polychromatic Barcode Symbology
- ^ Colorzip.com
- ^ "Barcodes for TV Commercials". Adverlab.blogspot.com. 2006-01-31. Retrieved 2009-06-10.
- ^ d-touch topological fiducial recognition; "d-touch markers are applied to deformable gloves", media.mit.edu
- ^ See Xerox.com for details.
- ^ Scanbuy.com
- ^ "BarCode-1 2-Dimensional Bar Code Page". Adams1.com. Retrieved 2009-06-10.
- ^ PaperDisk.com
- ^ Quickmark.com
- ^ (株)デンソーウェーブ, denso-wave.com Template:Ja icon Copyright
Bibliography
- Automating Management Information Systems: Barcode Engineering and Implementation – Harry E. Burke, Thomson Learning, ISBN 0-442-20712-3
- Automating Management Information Systems: Principles of Barcode Applications – Harry E. Burke, Thomson Learning, ISBN 0-442-20667-4
- The Bar Code Book – Roger C. Palmer, Helmers Publishing, ISBN 0-911261-09-5, 386 pages
- The Bar Code Manual – Eugene F. Brighan, Thompson Learning, ISBN 0-03-016173-8
- Handbook of Bar Coding Systems – Harry E. Burke, Van Nostrand Reinhold Company, ISBN 978-0-442-21430-2, 219 pages
- Information Technology for Retail:Automatic Identification & Data Capture Systems - Girdhar Joshi, Oxford University Press, ISBN 0-19-569796-0, 416 pages
- Lines of Communication – Craig K. Harmon, Helmers Publishing, ISBN 0-911261-07-9, 425 pages
- Punched Cards to Bar Codes – Benjamin Nelson, Helmers Publishing, ISBN 0-911261-12-5, 434 pages
- Revolution at the Checkout Counter: The Explosion of the Bar Code – Stephen A. Brown, Harvard University Press, ISBN 0-674-76720-9
- Reading Between The Lines – Craig K. Harmon and Russ Adams, Helmers Publishing, ISBN 0-911261-00-1, 297 pages
- The Black and White Solution: Bar Code and the IBM PC – Russ Adams and Joyce Lane, Helmers Publishing, ISBN 0-911261-01-X, 169 pages
- Sourcebook of Automatic Identification and Data Collection – Russ Adams, Van Nostrand Reinhold, ISBN 0-442-31850-2, 298 pages
External links
| Linear barcodes | ||
|---|---|---|
| Post office barcodes | ||
| 2D barcodes (stacked) | ||
| 2D barcodes (matrix) | ||
| Polar coordinate barcodes | ||
| Other | ||
| Technological issues | ||
| Other data tags | ||
| Related topics | ||