From Wikipedia, the free encyclopedia
1936 Greek legislative election
First party
Second party
Third party
Leader
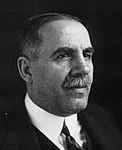
Eleftherios Venizelos
Panagis Tsaldaris
Georgios Kondylis
Party
Liberal
People's Party
GLRE
Leader since
1910
1922
1932
Last election
Boycotted
255 seats, 65.04%
32 seats, 65.04%
Seats won
126
72
60
Seat change
Boycotted
Popular vote
474,651
281,597
253,384
Percentage
37.26%
22.10%
19.89%
Swing
Boycotted
Fourth party
Fifth party
Sixth party
Leader
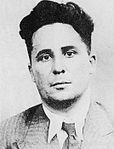
Nikos Zachariadis
Georgios Kafantaris
Ioannis Metaxas
Party
PM
DS
KE
Leader since
1931
1936
1922
Last election
0 seats, 9.59%
Boycotted
7 seats, 14.80%
Seats won
15
11
7
Seat change
Boycotted
Popular vote
73,411
53,693
50,137
Percentage
5.76%
4.21%
3.94%
Swing
Boycotted
Parliamentary elections were held in Greece on 26 January 1936.[ 1] Liberal Party emerged as the largest party in Parliament, winning 126 of the 300 seats.[ 2]
Results
Party
Votes
%
Seats
+/–
Liberal Party 474,651
37.3
126
New
People's Party 281,597
22.1
72
–183
General Popular Radical Union 253,384
19.9
60
+28
All People Front 73,411
5.8
15
New
Democratic Coalition 53,693
4.2
11
New
Freethinkers' Party 50,137
3.9
7
+1
National Reform Party 17,822
1.4
4
New
Old Democratic Union of Crete 13,762
1.1
3
New
Hellenic Agricultural Party 13,006
1.0
1
New
Agricultural Democratic Party 12,333
1.0
1
New
Independents' Alliance
11,178
0.9
0
New
National Unionist Party 9,870
0.8
0
New
Communist Archio-Marxist Party of Greece 1,148
0.1
0
New
National Union of Greece 505
0.0
0
0
Communist International Front
296
0.0
0
New
Independents
7,203
0.6
0
–6
Invalid/blank votes
4,083
–
–
–
Total 1,278,079 100 300 0
Registered voters/turnout
–
–
Source: Nohlen & Stöver
Popular vote
KF
37.26%
LK
22.10%
GLP
19.89%
PM
5.76%
DS
4.21%
KE
3.94%
MEK
1.40%
PEK
1.08%
AKE
1.02%
ADK
0.97%
Others
2.37%
Parliament seats
KF
42.00%
LK
24.00%
GLP
20.00%
PM
5.00%
DS
3.67%
KE
2.33%
MEK
1.33%
PEK
1.00%
AKE
0.33%
ADK
0.33%
References


