
Wellingborough Borough Council elections
The Borough Council of Wellingborough in Northamptonshire, UK is elected every four years. Since the last boundary changes in 1999, thirty-six councillors have been elected from 16 wards.[1]
Political control
Since the foundation of the council in 1973 political control of the council has been held by the following parties:[2]
| Party in control | Years |
|---|---|
| No overall control | 1973 - 1976 |
| Conservative | 1976 - 1995 |
| No overall control | 1995 - 1999 |
| Labour | 1999 - 2003 |
| Conservative | 2003–present |
Council elections
- 1973 Wellingborough Borough Council election
- 1976 Wellingborough Borough Council election
- 1979 Wellingborough Borough Council election
- 1983 Wellingborough Borough Council election (New ward boundaries)[3]
- 1987 Wellingborough Borough Council election
- 1991 Wellingborough Borough Council election
- 1995 Wellingborough Borough Council election
- 1999 Wellingborough Borough Council election (New ward boundaries increased the number of seats by 2)[4][5]
- 2003 Wellingborough Borough Council election
- 2007 Wellingborough Borough Council election
- 2011 Wellingborough Borough Council election
- 2015 Wellingborough Borough Council election (New ward boundaries)[6]
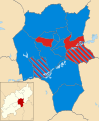
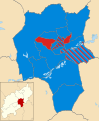
Borough result maps
-
 1999 results map
 -
 2003 results map
 -
 2007 results map
 -
 2011 results map
 -
 2015 results map


By-election results
1995-1999
| Party | Candidate | Votes | % | ±% | |
|---|---|---|---|---|---|
| Labour | 694 | 54.6 | +13.5 | ||
| Conservative | 530 | 41.7 | −8.5 | ||
| UKIP | 47 | 3.7 | +3.7 | ||
| Majority | 164 | 12.9 | |||
| Turnout | 1,271 | 29.4 | |||
| Labour gain from Conservative | Swing | ||||
2003-2007
| Party | Candidate | Votes | % | ±% | |
|---|---|---|---|---|---|
| Conservative | Lesley Callnon | 469 | 39.3 | −17.1 | |
| Labour | Andrew Scarborough | 445 | 37.3 | −6.3 | |
| UKIP | Anthony Ellwood | 173 | 14.5 | +14.5 | |
| Liberal Democrats | Penelope Wilkins | 105 | 8.8 | +8.8 | |
| Majority | 24 | 2.0 | |||
| Turnout | 1,192 | 23.4 | |||
| Conservative hold | Swing | ||||
| Party | Candidate | Votes | % | ±% | |
|---|---|---|---|---|---|
| Conservative | Graham Lawman | 885 | 61.1 | −4.3 | |
| Labour | Catherine Mulholland | 455 | 31.4 | −3.2 | |
| Green_Party_of_England_and_Wales | Jonathan Hornett | 62 | 4.3 | +4.3 | |
| UKIP | James Wrench | 45 | 3.1 | +3.1 | |
| Majority | 430 | 29.7 | |||
| Turnout | 1,447 | 27.8 | |||
| Conservative hold | Swing | ||||
| Party | Candidate | Votes | % | ±% | |
|---|---|---|---|---|---|
| Conservative | Bruce Thomas | 655 | 47.6 | +8.3 | |
| Labour | Patricia Cass | 488 | 35.4 | −1.9 | |
| UKIP | Anthony Ellwood | 162 | 11.8 | −2.7 | |
| Green | Jonathan Hornett | 71 | 5.1 | +5.1 | |
| Majority | 167 | 12.2 | +10.2 | ||
| Turnout | 1,376 | ||||
| Conservative gain from Independent | Swing | ||||
2007-2011
| Party | Candidate | Votes | % | ±% | |
|---|---|---|---|---|---|
| Conservative | Martin Griffiths | 698 | 52.6 | −7.3 | |
| Labour | Andrew Scarborough | 448 | 33.8 | −6.3 | |
| Independent | Ray Miles | 125 | 9.4 | +9.4 | |
| Green | Jonathan Hornett | 55 | 4.1 | +4.1 | |
| Majority | 250 | 18.8 | |||
| Turnout | 1,326 | 25.4 | |||
| Conservative hold | Swing | ||||
| Party | Candidate | Votes | % | ±% | |
|---|---|---|---|---|---|
| Conservative | Jim Bass | 363 | 66.0 | +8.3 | |
| Liberal Democrats | Stuart Simons | 149 | 27.1 | +27.1 | |
| Labour | Peter Wright | 38 | 6.9 | +6.9 | |
| Majority | 214 | 38.9 | |||
| Turnout | 550 | 37.0 | |||
| Conservative hold | Swing | ||||
| Party | Candidate | Votes | % | ±% | |
|---|---|---|---|---|---|
| Conservative | Andrew Bigley | 665 | 59.0 | −18.5 | |
| BNP | David Robinson | 177 | 15.7 | +15.7 | |
| Labour | Elaine Baggott | 169 | 15.0 | −7.5 | |
| Liberal Democrats | Jane Brown | 40 | 3.5 | +3.5 | |
| UKIP | Tony Ellwood | 39 | 3.5 | +3.5 | |
| Green | Jonathan Hornett | 37 | 3.3 | +3.3 | |
| Majority | 488 | 43.3 | −11.7 | ||
| Turnout | 1127 | 47.1 | |||
| Conservative hold | Swing | ||||
| Party | Candidate | Votes | % | ±% | |
|---|---|---|---|---|---|
| Conservative | Jo Beirne | 816 | 81.1 | +10.6 | |
| Independent | Peter Wright | 97 | 9.7 | +9.7 | |
| Liberal Democrats | Jane Brown | 93 | 9.2 | +9.2 | |
| Majority | 719 | 71.4 | |||
| Turnout | 1006 | 32.9 | −6.6 | ||
| Conservative hold | Swing | ||||
| Party | Candidate | Votes | % | ±% | |
|---|---|---|---|---|---|
| Conservative | Geoffrey Simmons | 750 | 47.3 | +1.6 | |
| Labour | Patricia Jones | 316 | 19.9 | −11.3 | |
| Green | Jonathan Hornett | 189 | 11.9 | +11.9 | |
| Independent | Jacqueline Norton | 183 | 11.5 | −11.5 | |
| Liberal Democrats | Julie White | 149 | 9.4 | +9.4 | |
| Majority | 434 | 27.3 | |||
| Turnout | 1587 | 37.7 | −2.8 | ||
| Conservative hold | Swing | ||||
| Party | Candidate | Votes | % | ±% | |
|---|---|---|---|---|---|
| Conservative | Robert Hawkes | 548 | 46.0 | −9.6 | |
| Labour | Helena Reynolds | 361 | 30.3 | −14.0 | |
| Liberal Democrats | Daniel Jones | 162 | 13.6 | +13.6 | |
| BNP | David Robinson | 120 | 10.1 | +10.1 | |
| Majority | 187 | 15.7 | |||
| Turnout | 1,191 | 27.4 | |||
| Conservative hold | Swing | ||||
| Party | Candidate | Votes | % | ±% | |
|---|---|---|---|---|---|
| Conservative | John Raymond | 570 | 57.2 | −20.3 | |
| Labour | Graham Sherwood | 186 | 18.7 | −3.9 | |
| BNP | David Robinson | 84 | 8.4 | +8.4 | |
| Liberal Democrats | Penelope Wilkins | 72 | 7.2 | +7.2 | |
| English Democrat | Terence Spencer | 62 | 6.2 | +6.2 | |
| Green | Jonathan Hornett | 23 | 2.3 | +2.3 | |
| Majority | 384 | 38.5 | |||
| Turnout | 997 | 38.4 | |||
| Conservative hold | Swing | ||||
References
- ^ "About Us". Borough Council of Wellingborough. Retrieved 2010-02-24.
- ^ "Wellingborough". BBC News Online. Retrieved 2009-10-05.
- ^ legislation.gov.uk - The Borough of Wellingborough (Electoral Arrangements) Order 1979. Retrieved on 19 November 2015.
- ^ "Wellingborough". BBC News Online. Retrieved 2010-02-24.
- ^ legislation.gov.uk - The Borough of Wellingborough (Electoral Changes) Order 1998. Retrieved on 4 October 2015.
- ^ legislation.gov.uk - The Wellingborough (Electoral Changes) Order 2014. Retrieved on 3 November 2015.
- ^ "Croyland By-Election Results". Borough Council of Wellingborough. 2004-10-26. Retrieved 2009-10-05.
- ^ "Lib Dems and Labour make byelection gains". guardian.co.uk. 2006-04-07. Retrieved 2009-10-05.
- ^ "Boost for Brown in latest council by-elections". 24dash.com. 2008-03-28. Retrieved 2009-10-05.
- ^ "Wellingborough Council by-election result". Northamptonshire Evening Telegraph. 2009-05-29. Retrieved 2009-10-05.
- ^ "By-election in Wellingborough". Northamptonshire Evening Telegraph. 2009-07-24. Retrieved 2009-10-05.
- ^ "Declaration of result of poll" (PDF). Borough Council of Wellingborough. Retrieved 2010-03-12.