From Wikipedia, the free encyclopedia
1936 Swedish general election|
|
|
|
|
|
 Party activists handing out ballot papers for their parties outside a polling booth
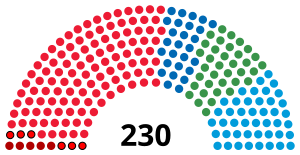
General elections were held in Sweden on 20 September 1936.[3] The Swedish Social Democratic Party remained the largest party, winning 112 of the 230 seats in the Second Chamber of the Riksdag.[4]
Results
|
| Party
|
Votes
|
%
|
Seats
|
+/–
|
| Social Democratic Party |
1,338,120 |
45.9 |
112 |
+8
|
| General Electoral League |
512,781 |
17.6 |
44 |
–14
|
| Farmers' League |
418,840 |
14.4 |
36 |
0
|
| People's Party |
376,161 |
12.9 |
27 |
+3
|
| Socialist Party |
127,832 |
4.4 |
6 |
0
|
| Communist Party |
96,519 |
3.3 |
5 |
+3
|
| National League of Sweden |
26,750 |
0.9 |
0 |
New
|
| National Socialist Workers' Party |
17,483 |
0.6 |
0 |
New
|
| Swedish National Socialist Party |
3,025 |
0.1 |
0 |
0
|
| Other parties |
242 |
0.0 |
0 |
0
|
| Invalid/blank votes |
8,023 |
– |
– |
–
|
| Total |
2,925,776 |
100 |
230 |
0
|
| Registered voters/turnout |
3,924,598 |
74.5 |
– |
–
|
| Source: Nohlen & Stöver
|
| Popular vote |
|---|
|
|
|
| S |
|
45.86% |
| AV |
|
17.57% |
| B |
|
14.35% |
| FP |
|
12.89% |
| SP |
|
4.38% |
| SKP |
|
3.31% |
| Others |
|
1.63% |
|
| Parliament seats |
|---|
|
|
|
| S |
|
48.70% |
| AV |
|
19.13% |
| B |
|
15.65% |
| FP |
|
11.74% |
| SP |
|
2.61% |
| SKP |
|
2.17% |
|
References


