From Wikipedia, the free encyclopedia
1978 Belgian general election
First party
Second party
Third party
Leader
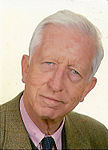
Paul Vanden Boeynants
André Cools
Karel Van Miert
Party
CVP
PS
sp.a
Leader since
Candidate for PM
1978
1978
Last election
56 seats, 26.20%
New
New
Seats won
57
31
26
Seat change
New
New
Popular vote
1,447,112
689,876
684,976
Percentage
26.14%
12.46%
12.37%
Swing
New
New
Fourth party
Fifth party
Sixth party
Leader
Charles-Ferdinand Nothomb
Willy De Clercq
André Damseaux
Party
cdH
Open Vld
PRL
Leader since
1977
1977
1973
Last election
24 seats, 7.29%
17 seats, 8.54%
16 seats, 3.34%
Seats won
25
22
15
Seat change
Popular vote
560,440
573,387
256,685
Percentage
10.12%
10.36%
4.64%
Swing
Colours denote the winning party in each electoral district (for the Chamber of Deputies).
General elections were held in Belgium on 17 December 1978.[1] Christian People's Party emerged as the largest party, with 57 of the 212 seats in the Chamber of Representatives and 29 of the 106 seats in the Senate . Voter turnout was 94.8%.[2] Council of the German Cultural Community .
The snap elections were called after Prime Minister Leo Tindemans resigned over the Egmont pact , which would have transformed Belgium into a federal state. Vlaams Blok participated for the first time, which was formed out of disagreement within the People's Union over concessions in the Egmont pact.
Results Chamber of Deputies The primary six Flemish political parties and their results for the House of Representatives (Kamer). From 1978 to 2014, in percentages for the complete 'Kingdom'.
Party
Votes
%
Seats
+/–
Christian People's Party 1,447,112
26.14
57
+1
Belgian Socialist Party (Wallonia) 689,876
12.46
31
+31
Belgian Socialist Party (Flanders) 684,976
12.37
26
–1
Party for Freedom and Progress 573,387
10.36
22
+5
Christian Social Party 560,440
10.12
25
+1
People's Union 388,762
7.02
14
–6
Democratic Front of the Francophones 259,019
4.68
11
0
Liberal Reformist Party 256,685
4.64
15
–1
Communist Party of Belgium 180,234
3.26
4
+4
Walloon Rally 128,153
2.32
4
0
Vlaams Blok 75,635
1.37
1
+1
UDRT/RAD 48,616
0.88
1
+1
AMA/TPO
43,483
0.79
0
New
PL
41,460
0.75
0
New
PRLW /PRF31,280
0.57
0
0
Belgian Socialist Party (Luxembourg) 30,222
0.55
1
New
Ecolo 21,224
0.38
0
0
PLW
9,861
0.18
0
New
Party of German-speaking Belgians 9,032
0.16
0
0
ECOLOG
8,360
0.15
0
0
Walloon Rally (Luxembourg) 6,493
0.12
0
New
AGALEV 5,556
0.10
0
0
ECOPOL
3,922
0.07
0
New
LSDP
3,678
0.07
0
New
BNP-PNB
3,465
0.06
0
New
LRT
2,597
0.05
0
0
PLF
2,313
0.04
0
New
PPB
2,123
0.04
0
New
UDP
1,843
0.03
0
New
GROEN
1,761
0.03
0
New
PFU
1,686
0.03
0
0
PF-ECO
1,512
0.03
0
New
KAGANO
1,376
0.02
0
0
PVCM
993
0.02
0
New
PFN
729
0.01
0
New
LP-PL
698
0.01
0
New
PDE
375
0.01
0
New
PDRT
311
0.01
0
New
Invalid/blank votes
507,058
–
–
–
Total 6,042,689 100 212 0
Source: Belgian Elections
Senate
Party
Votes
%
Seats
+/–
Christian People's Party 1,420,777
25.93
29
+1
Belgian Socialist Party (Wallonia) 685,307
12.51
17
–2
Belgian Socialist Party (Flanders) 678,776
12.39
13
+1
Party for Freedom and Progress 572,535
10.45
11
+2
Christian Social Party 535,939
9.78
12
+1
People's Union 384,562
7.02
7
–3
Liberal Reformist Party -PL330,155
6.03
6
New
Democratic Front of the Francophones 266,713
4.87
7
New
Communist Party of Belgium 182,711
3.33
1
0
Walloon Rally 123,794
2.26
2
0
Vlaams Blok 80,809
1.47
0
New
UDRT/RAD 51,571
0.94
0
New
AMA/TPO
44,379
0.81
0
New
Ecolo 43,883
0.80
0
0
Belgian Socialist Party (Luxembourg) 30,837
0.56
1
New
Party of German-speaking Belgians 11,148
0.20
0
0
PLW
11,081
0.2
0
New
Walloon Rally (Luxembourg) 6,659
0.12
0
New
RAL/LRT
3,744
0.07
0
New
LSDP
3,239
0.06
0
New
PPB
2,804
0.05
0
New
PLF
2,640
0.05
0
New
UDP
2,221
0.04
0
New
PFU
2,045
0.04
0
New
PCR
917
0.02
0
New
Invalid/blank votes
565,299
–
–
–
Total 6,044,545 100 106 0
Source: Belgian Elections
References


