General elections were held in Sweden on 16 September 1979.[1] Although the Swedish Social Democratic Party remained the largest party, winning 154 of the 349 seats in the Riksdag,[2] the liberalinterim government of Ola Ullsten was succeeded by another centre-right coalition government composed of the People's Party, the Moderate Party and the Centre Party, led by Centre Party leader Thorbjörn Fälldin. The three parties together won 175 seats, compared to the 174 won by the Social Democrats and Communists. It was the only time that non-socialist parties retained power in an election between 1928 and 2010. The Moderates dramatically increased their representation in the Riksdag, becoming the largest party of the non-socialist bloc, a position they have maintained ever since.
Despite the unexpected victory, the coalition split in 1981 when the Moderates withdrew support in protest at Fälldin's tax policies, which they viewed as "too leftist". Despite not being the leader of the coalition party with the most seats, Fälldin had been the designate Prime Minister since his earlier resignation in 1978, upon disagreement over the question of nuclear power.
Votes by municipality. The municipalities are the color of the party that got the most votes within the coalition that won relative majority.
Cartogram of the map to the left with each municipality rescaled to the number of valid votes cast.
Map showing the voting shifts from the 1976 to the 1979 election. Darker blue indicates a municipality voted more towards the parties that formed the centre-right bloc. Darker red indicates a municipality voted more towards the parties that form the left-wing bloc.
Votes by municipality as a scale from red/Left-wing bloc to blue/Centre-right bloc.
Cartogram of vote with each municipality rescaled in proportion to number of valid votes cast. Deeper blue represents a relative majority for the centre-right coalition, brighter red represents a relative majority for the left-wing coalition.

.jpg)
.jpg)


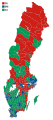 Votes by municipality. The municipalities are the color of the party that got the most votes within the coalition that won relative majority.
 Cartogram of the map to the left with each municipality rescaled to the number of valid votes cast.
 Map showing the voting shifts from the 1976 to the 1979 election. Darker blue indicates a municipality voted more towards the parties that formed the centre-right bloc. Darker red indicates a municipality voted more towards the parties that form the left-wing bloc.
 Votes by municipality as a scale from red/Left-wing bloc to blue/Centre-right bloc.
 Cartogram of vote with each municipality rescaled in proportion to number of valid votes cast. Deeper blue represents a relative majority for the centre-right coalition, brighter red represents a relative majority for the left-wing coalition.


